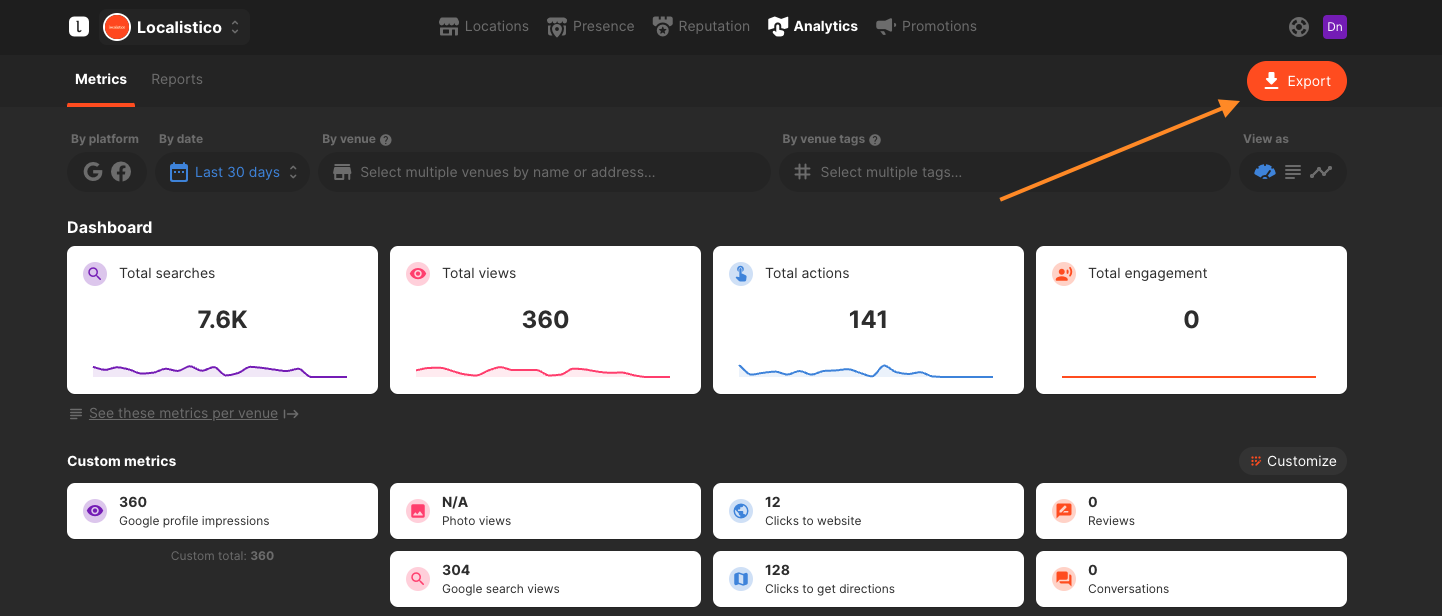
The metrics page is accessible under the Analytics tab in Localistico. Here, you can view essential data, such as the number of views your location has obtained and how often users have requested directions to your business.
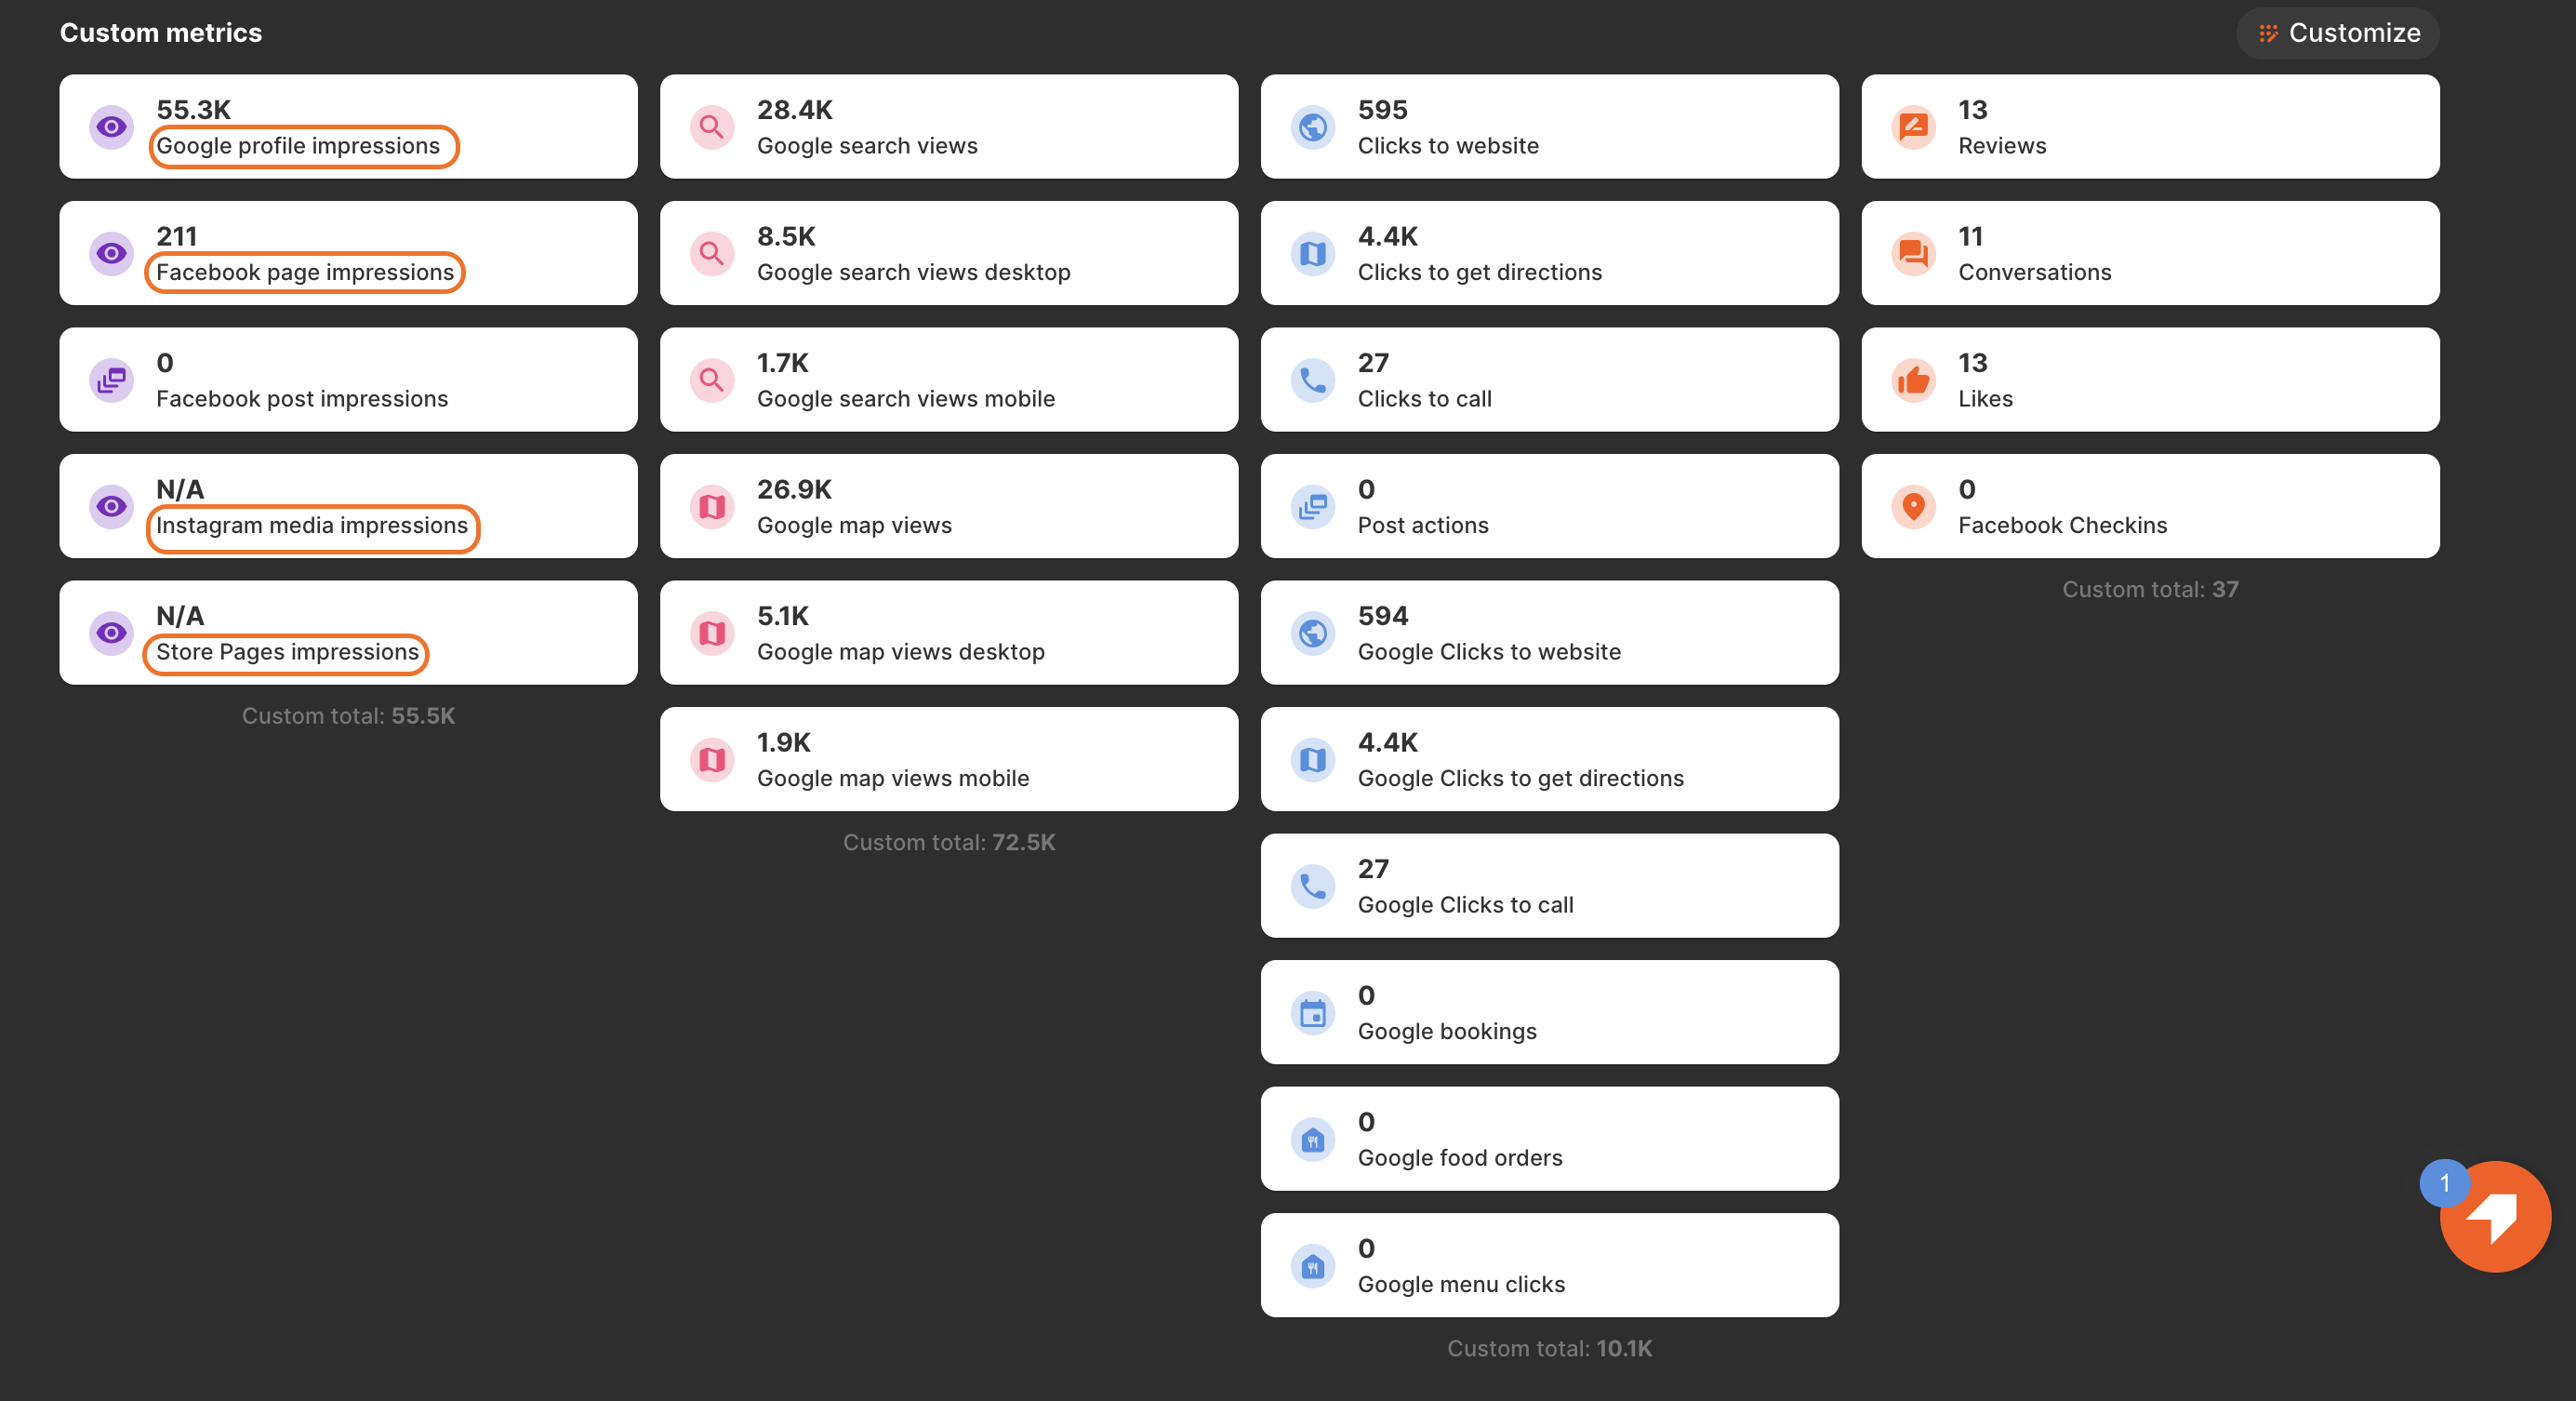
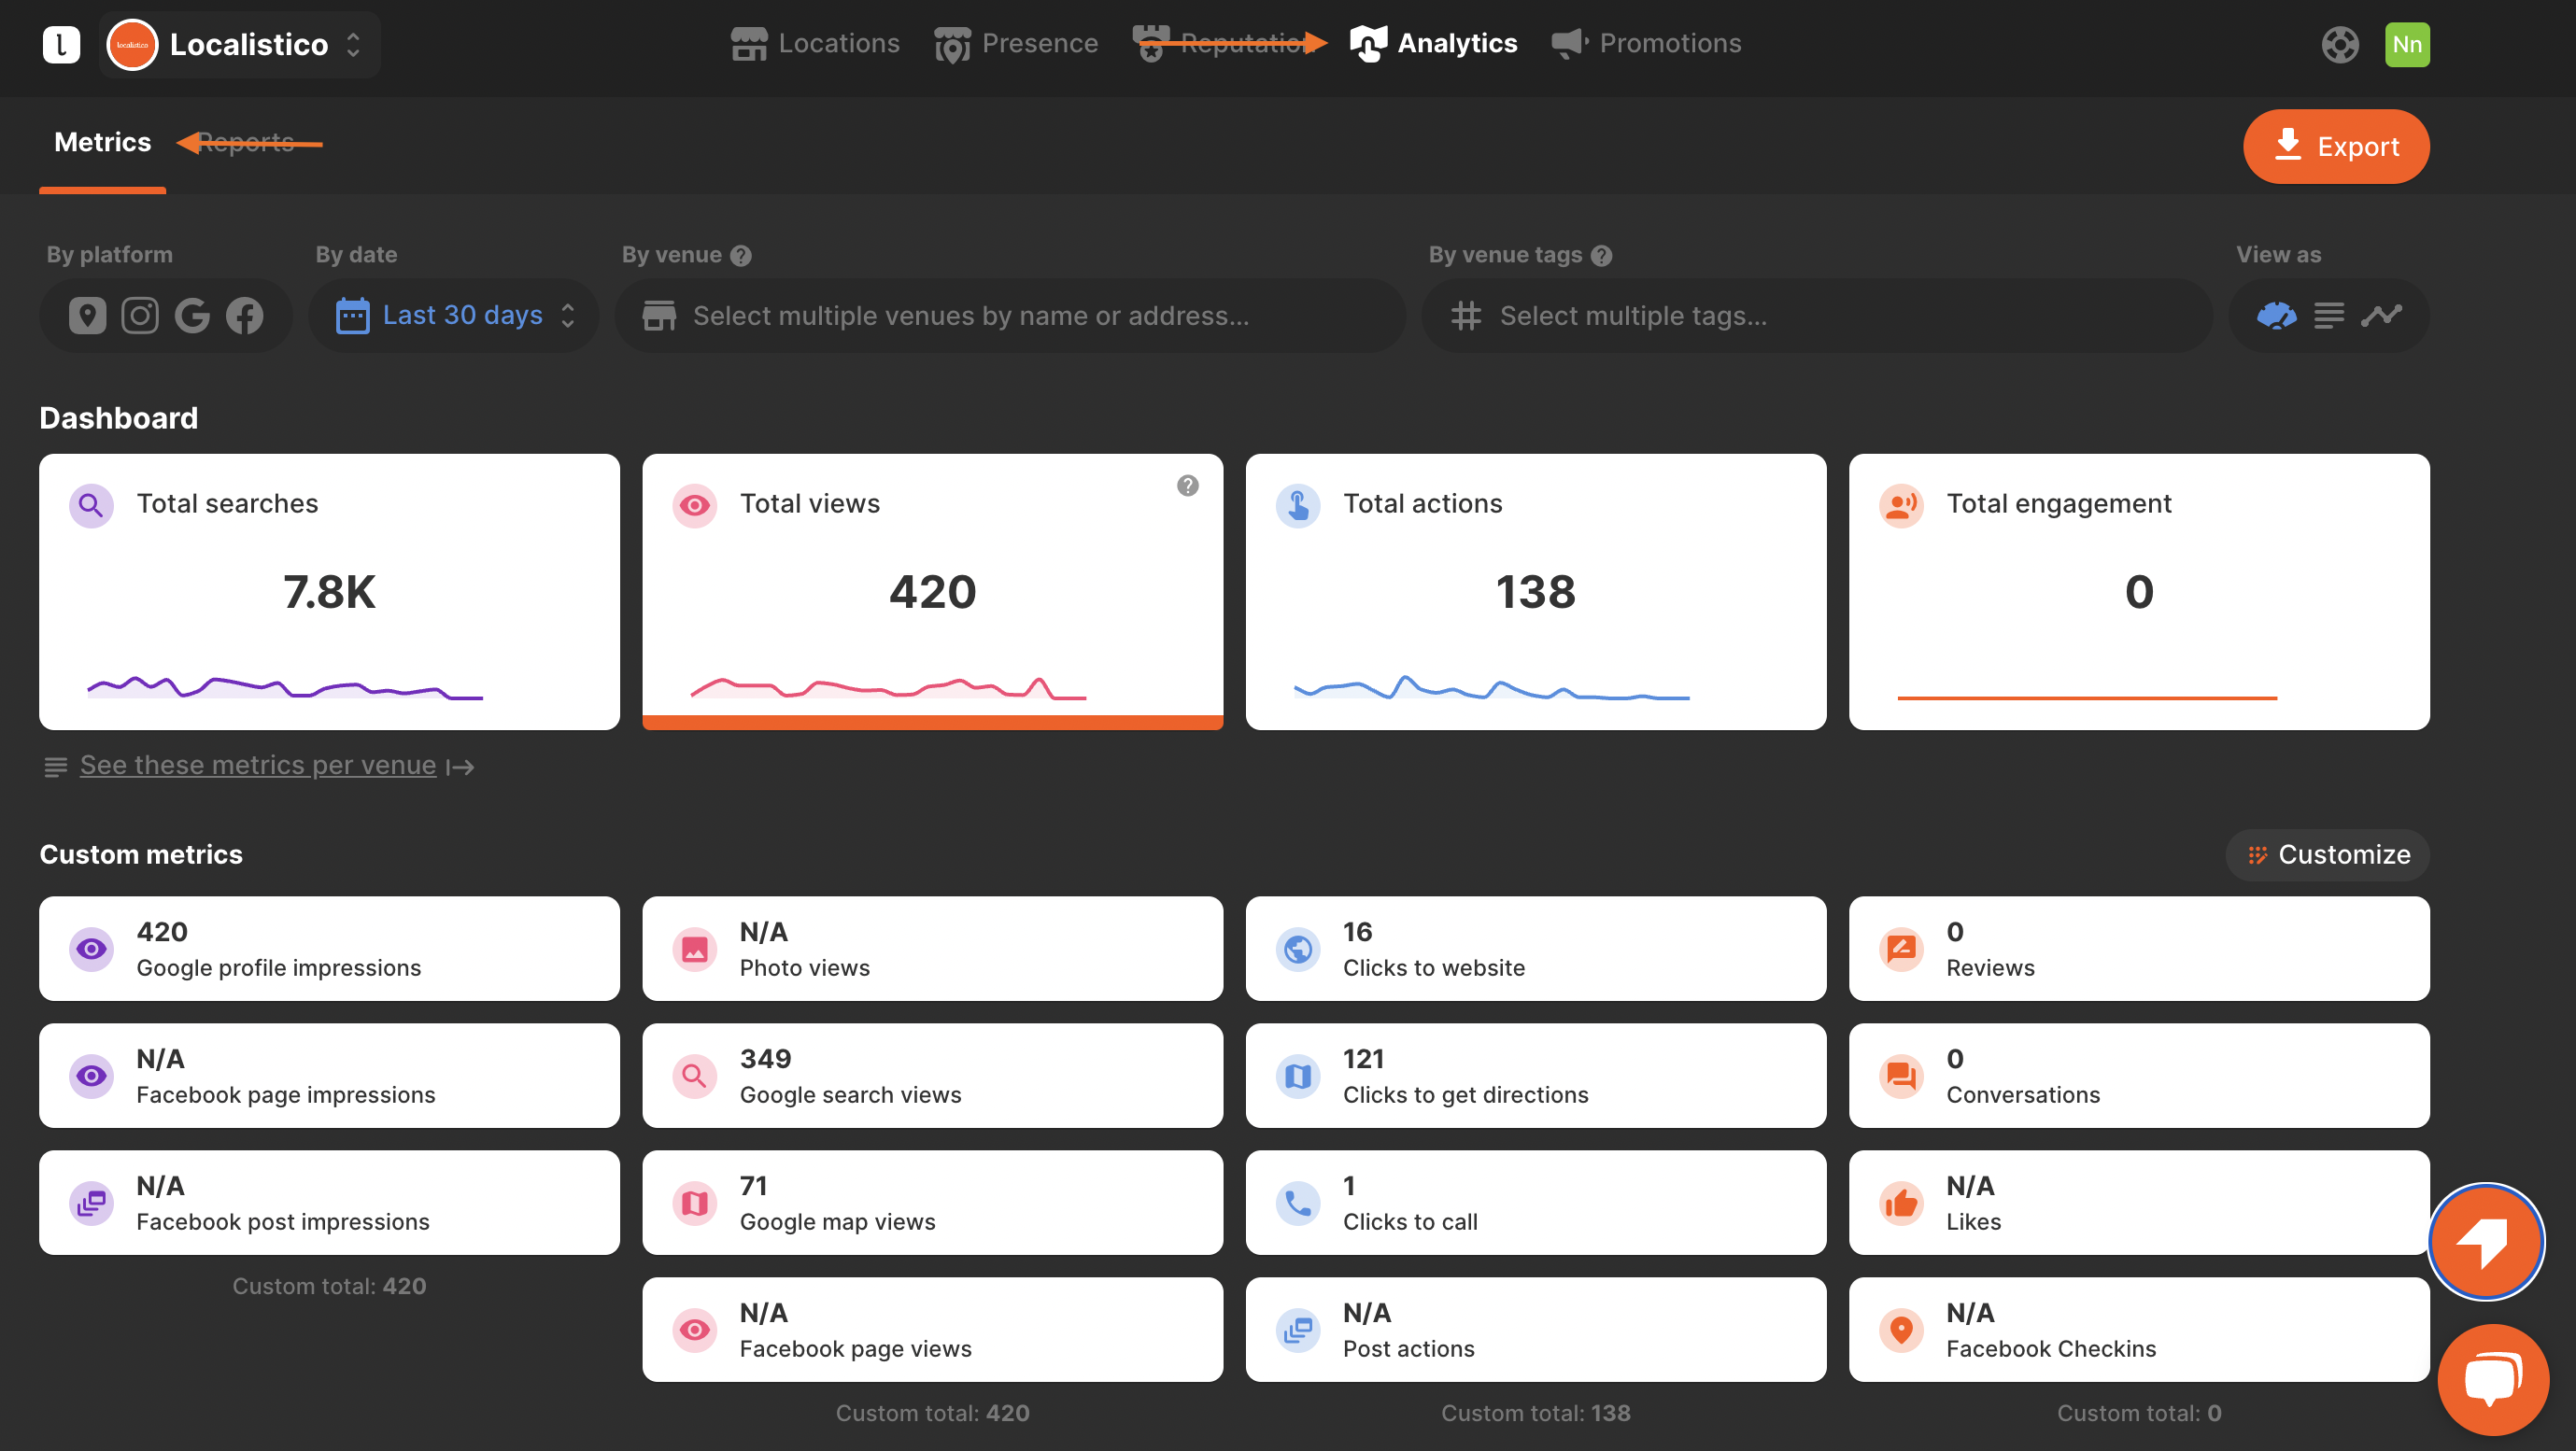 Metrics are currently available for Google, Facebook, Apple, Instagram, and Store Pages. You can analyse the metrics from a single platform or all of them simultaneously, allowing you to tailor the insights to your specific needs. Be aware that certain metrics may be exclusive to individual platforms; this will be indicated alongside the data.
How to compare the metrics?
Analyze the changes in impressions, searches, and customer actions your profiles have experienced by comparing two distinct time periods. To effectively compare data from these periods, please:
1. Click on the filter by date
2. Select the period
3. Click on compare
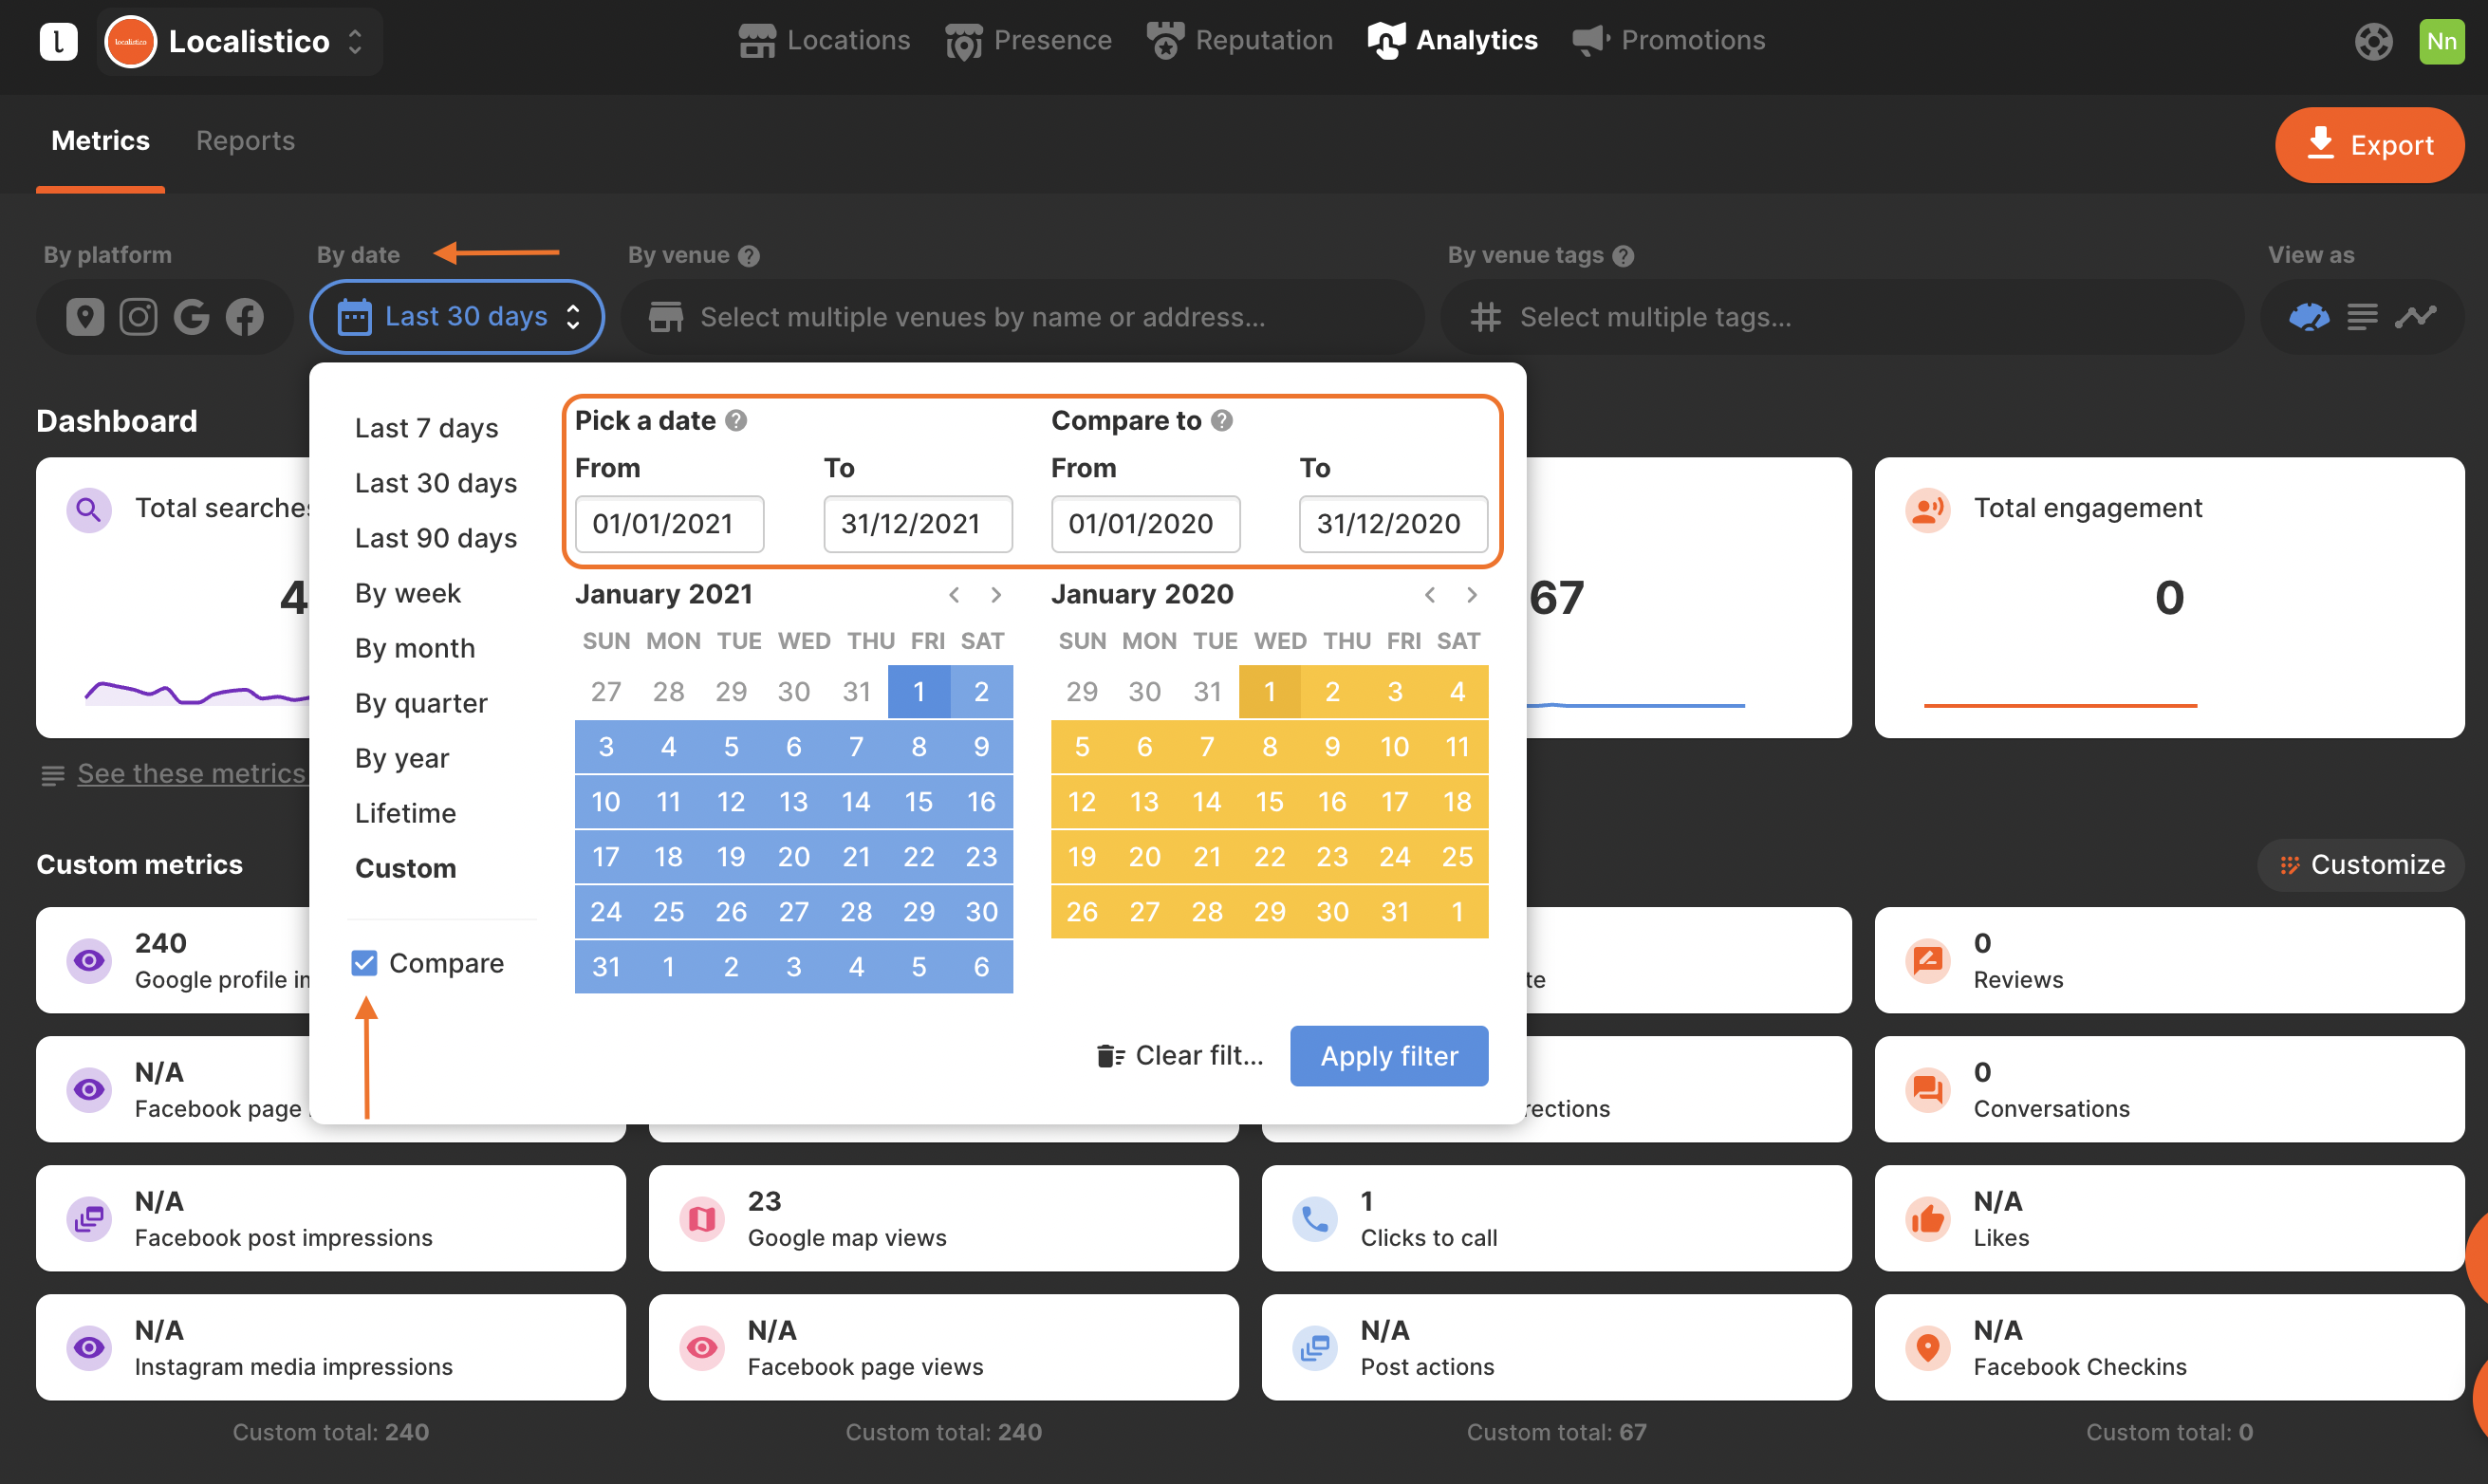
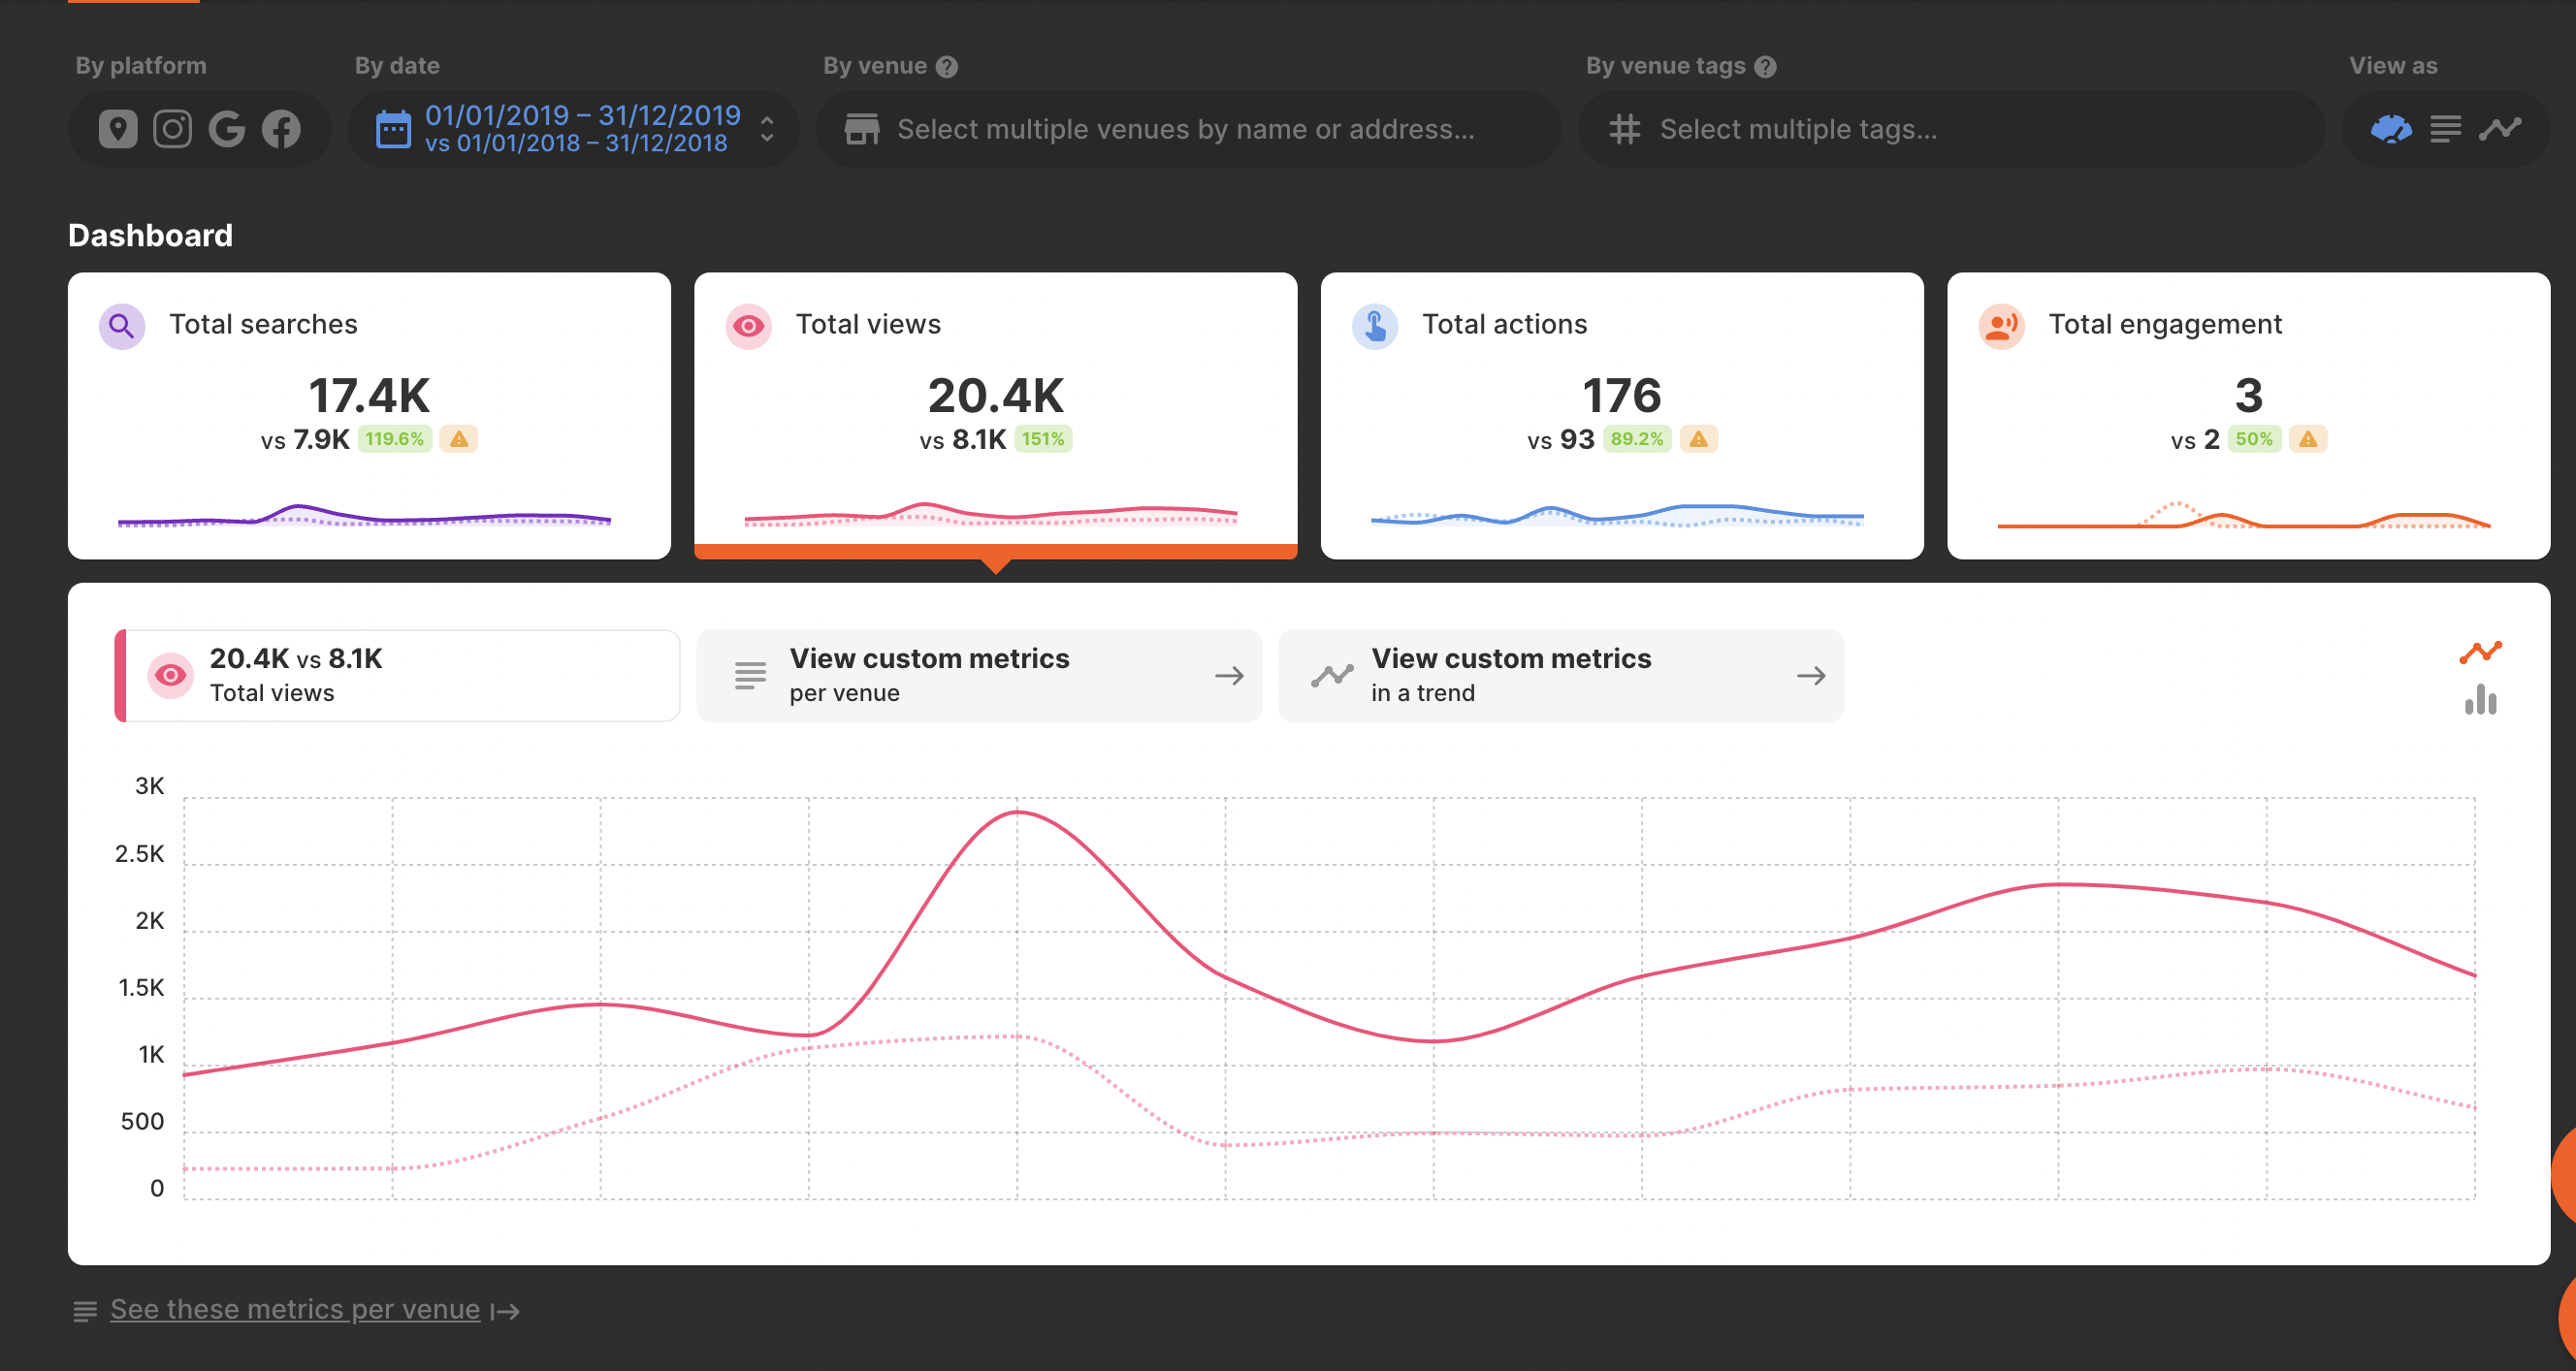
4. Modify the second period to ensure you are comparing two equivalent timeframes. It is advisable to select periods that correspond to the same dates for accurate data analysis. For instance, comparing Q1 2020 with Q2 2020 may reveal fluctuations influenced by seasonal trends rather than genuine enhancements in your location data or marketing efforts. After adjusting the periods, click on Apply filter.
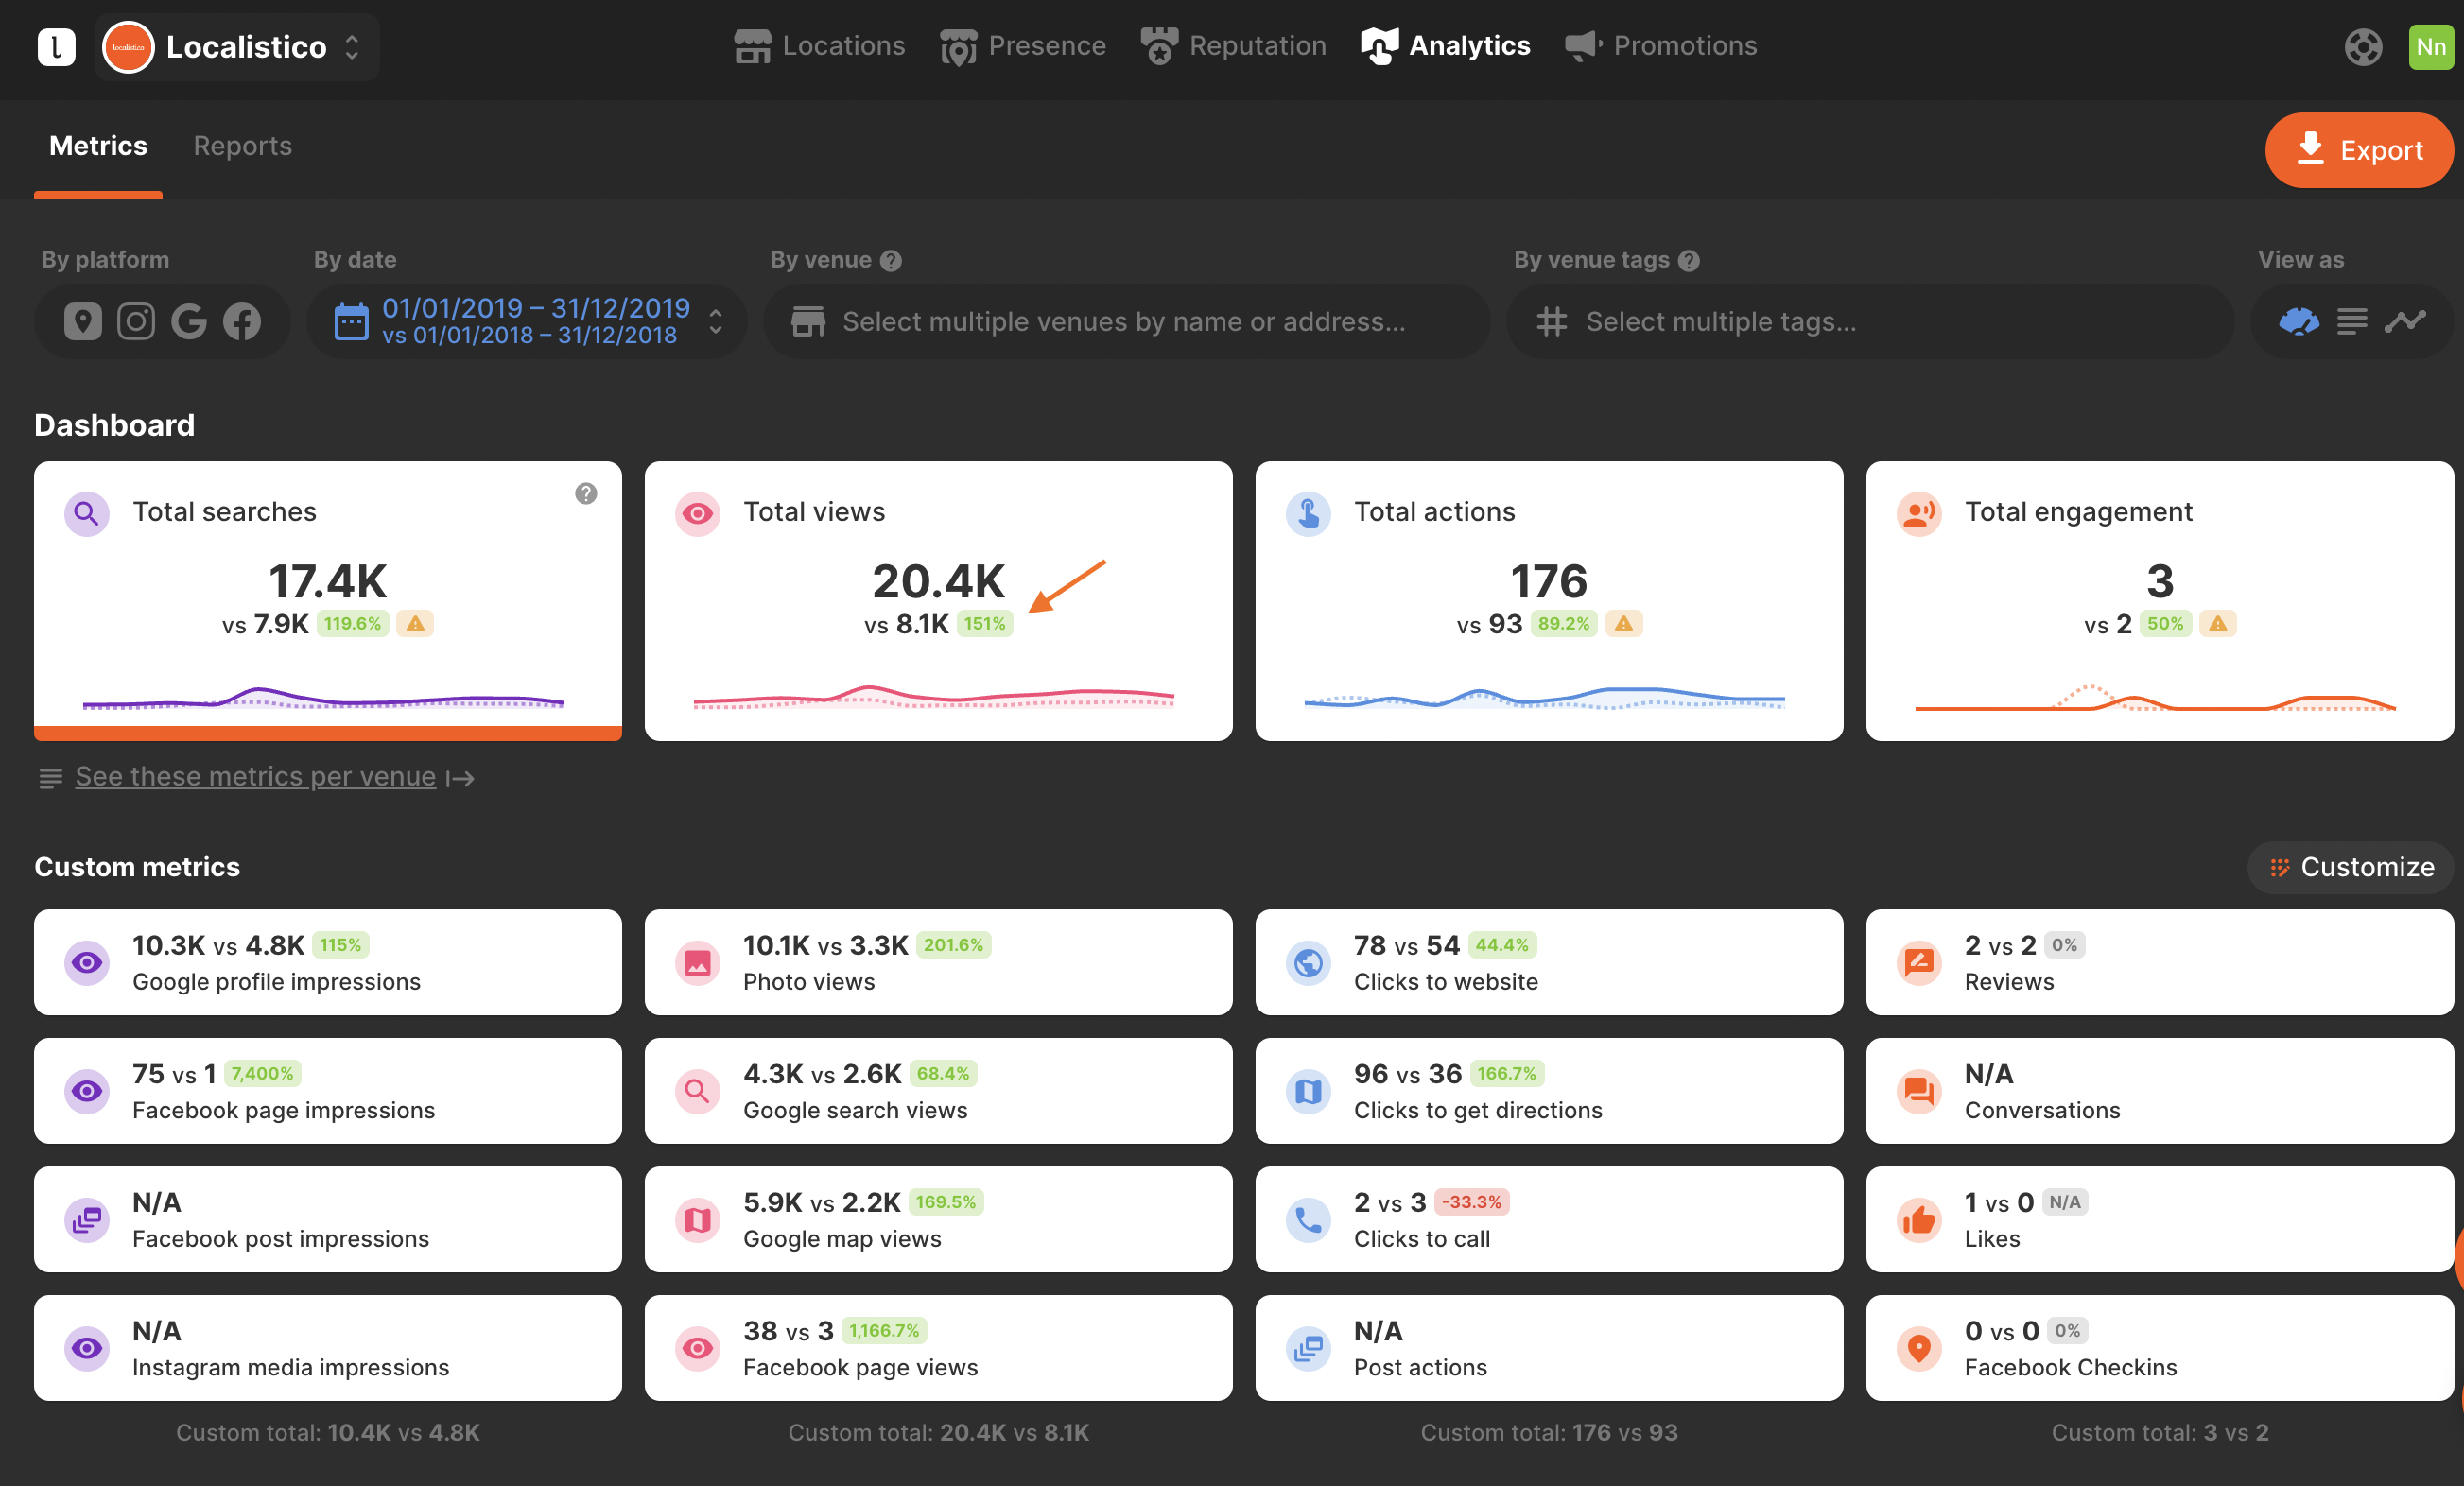
5. Localistico provides a percentage-based analysis of data trends. By clicking on each metrics box, you can access visual representations that highlight the times when your profiles experienced the highest levels of impressions, searches, or customer interactions. This valuable insight allows you to pinpoint successful marketing strategies and make informed, data-driven decisions.
The data can be downloaded in Excel or CSV format by clicking the orange button with the arrow located in the upper right corner.
 Please note that Google may take 7 days to collect your metrics. For example, as of 23 May, you should have metrics until the 17th of May.