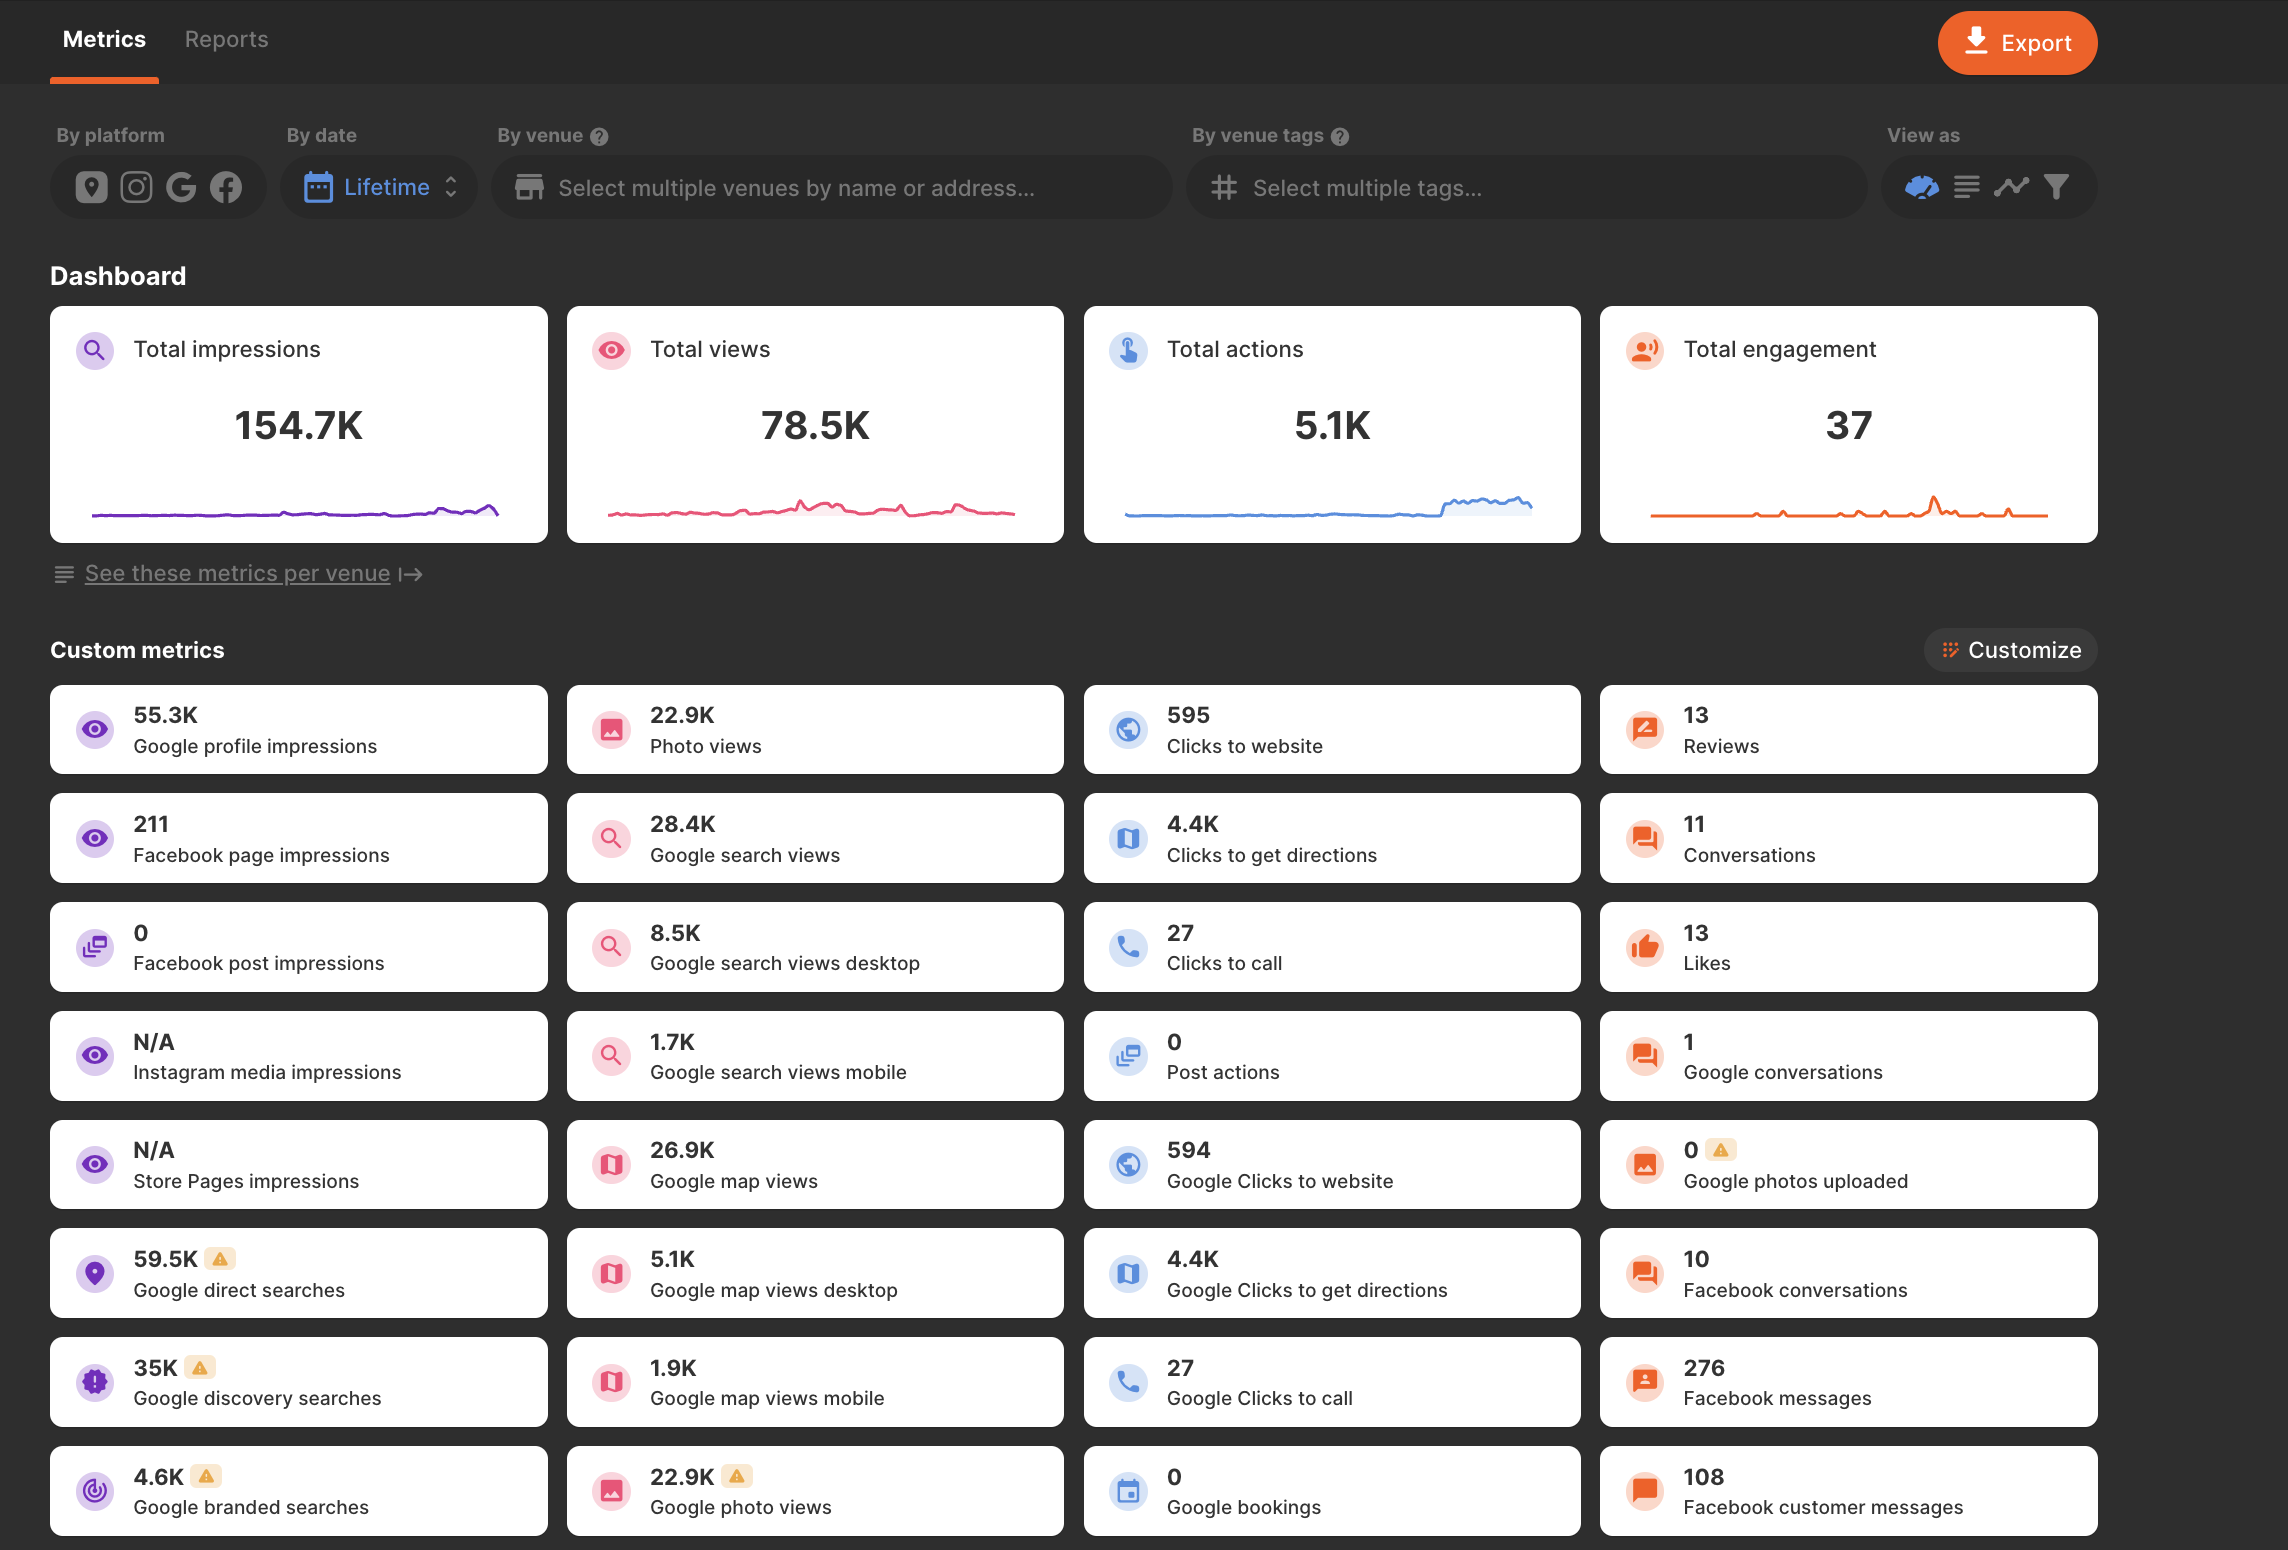
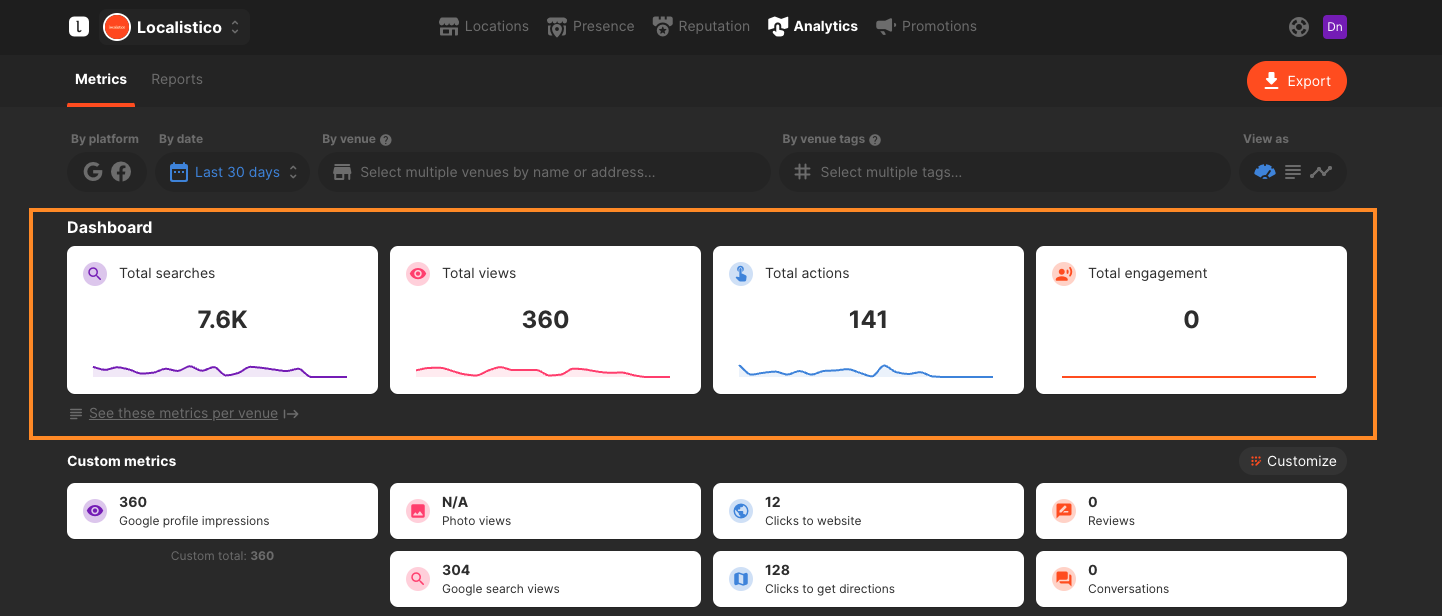
Customisable metrics dashboard and overview
Localistico extracts around 60 metrics from different platforms. Those metrics are available for you under analytics tab in the metrics section. Having all these metrics visible on the dashboard can be an overwhelming experience. Therefore, to avoid unnecessary noise, Localistico allows customising the dashboard and select only the metrics that are important for your business.
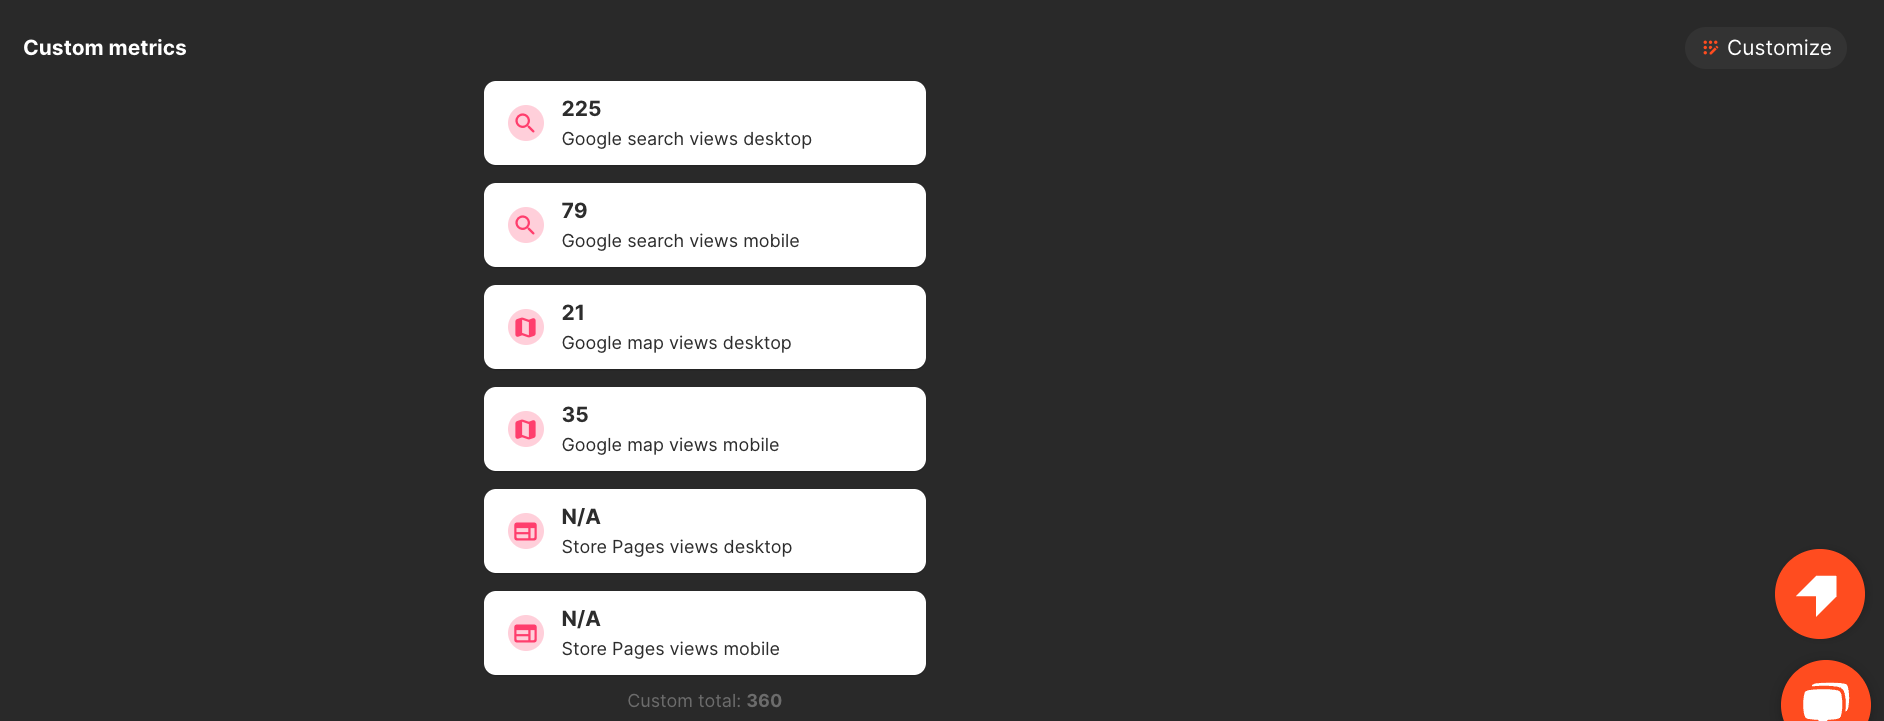
One example could be to select the metrics that allow you to see the performance breakdown by device to understand if your traffic is coming from mobile or desktop devices:
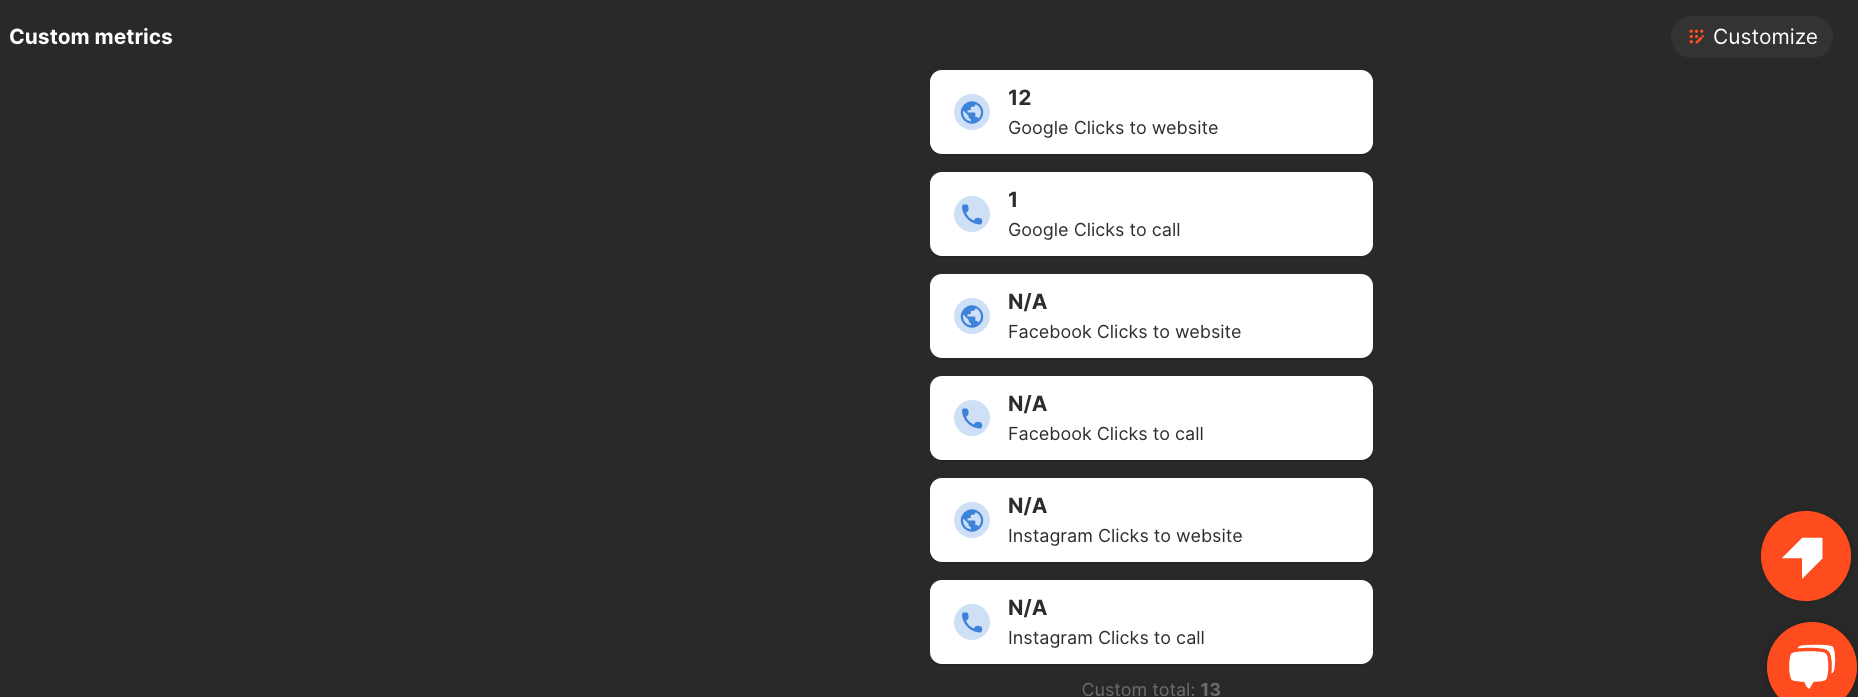
Another example is to focus on the clicks and web engagement and select the metrics that allow you to see from which platforms your customers are clicking to call or visit the website:
How to select the metrics that are important for my business?
To select the metrics that are important for you, please:
- click on the customise button
- select the metrics you would like to see in each section (searches, views, actions or engagement)
- Save your configuration
 Customised metrics dashboard is saved for the user who created it. Each user can create their own dashboard.
The total metrics are displayed for all users in their own section. These metrics will show the total views, searches, actions and engagement of your business. This section is not currently customisable:
How to see trends?
Users can view the metrics trends by clicking on the trends button and later select up to 8 metrics. This selection won't affect the dashboard configuration and will not be saved. The URL of the trends dashboard is a saved view and can be shared with other team members.
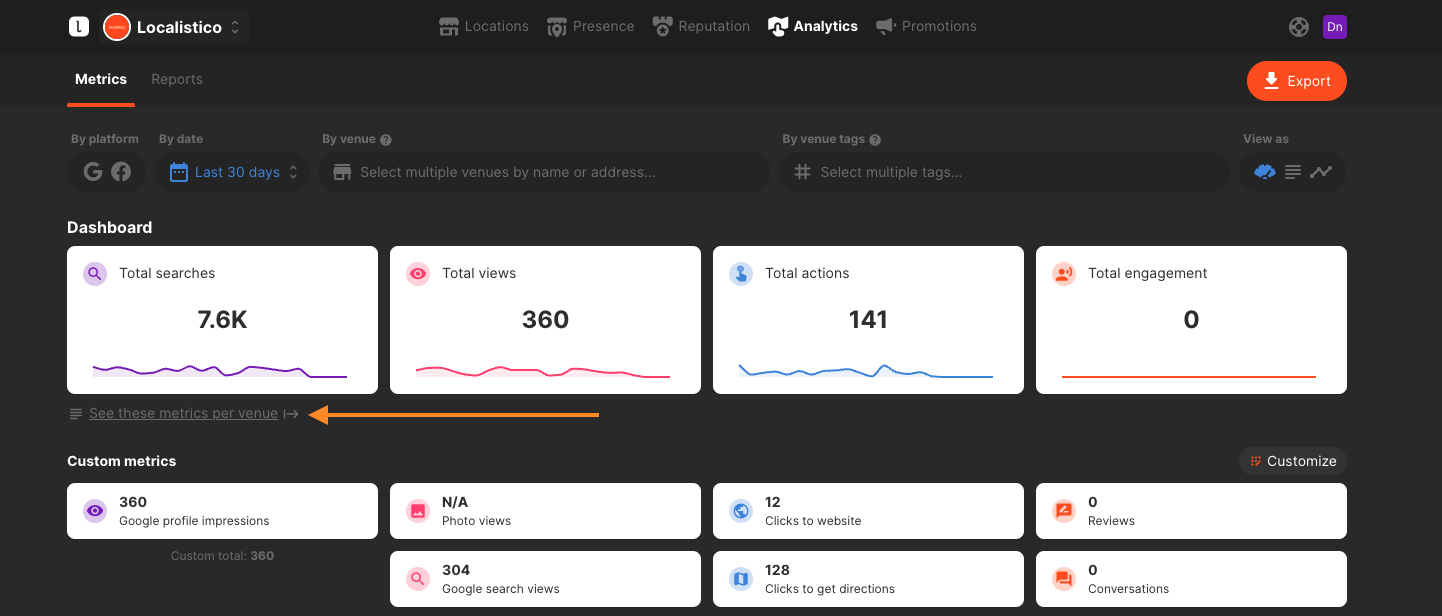
How to see metrics per venue?
Metrics per venue are visible by clicking on the button See these metrics per venue →
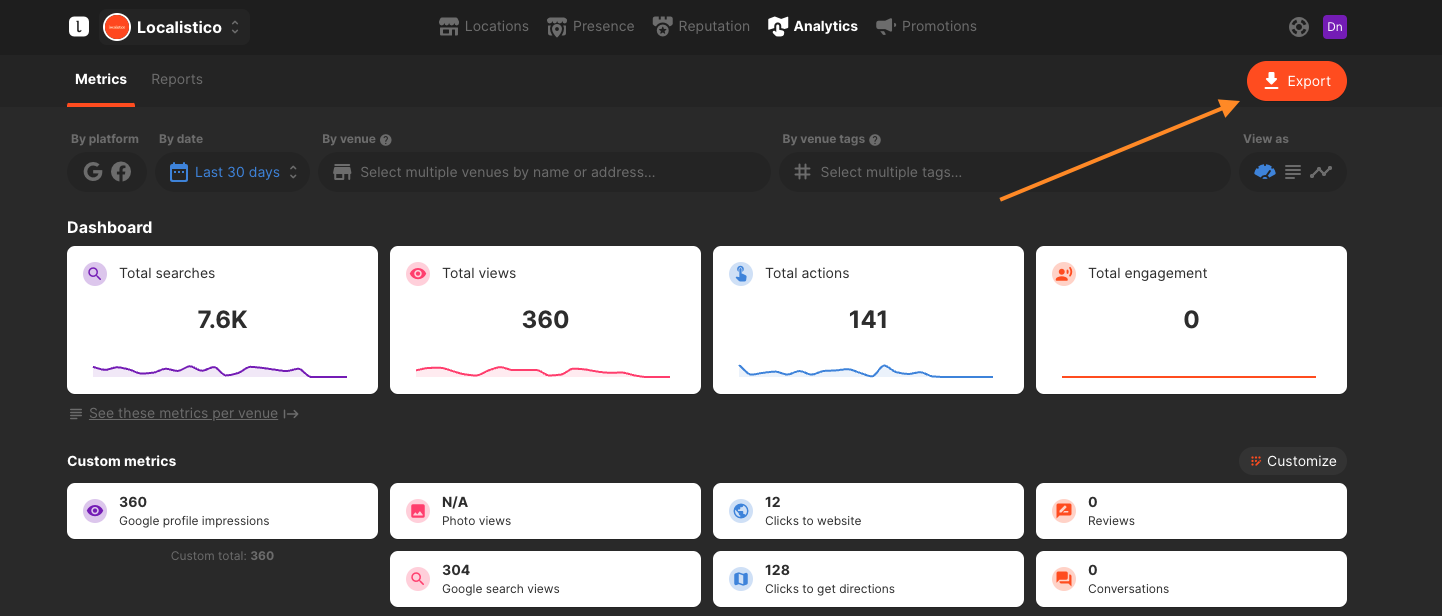
How to export metrics?
Metrics can be exported by clicking on the export button. In the exporter, all metrics will be exported without taking into account any customisations. The same logic applies to data feeds as well.
FAQ
Why do I see “N/A” in my metrics?
Technically, there is a difference between a 0 and an N/A when referring to metrics.
Let’s take for example the metric Facebook likes for a specific date. A value of “0” means there was nobody that liked the profile. This means we have data about what happened on that date and there were no likes. The difference with an N/A value is that we don’t have data for that date. Some users may have liked your profiles, but we just don't know it because your Facebook credentials, for example, are not connect and we cannot extract the data.
Why don't I have metrics from the last 2–4 days?
Some platforms take a few days to update the information, either in their own app or in their API. Google metrics will be fully available within every last 7 days. For example, as of 23 May, you should have metrics until 17th of May.
Can I see all the historic data of my profiles on Localisico?
It depends. If we have extracted that data in the past, we store it in our databases and the information can be shown. For new clients, it depends on the platform and the amount of time they offer “historic data”. At any given moment, Google offers up to 18 months of data, while Facebook does 24 months.