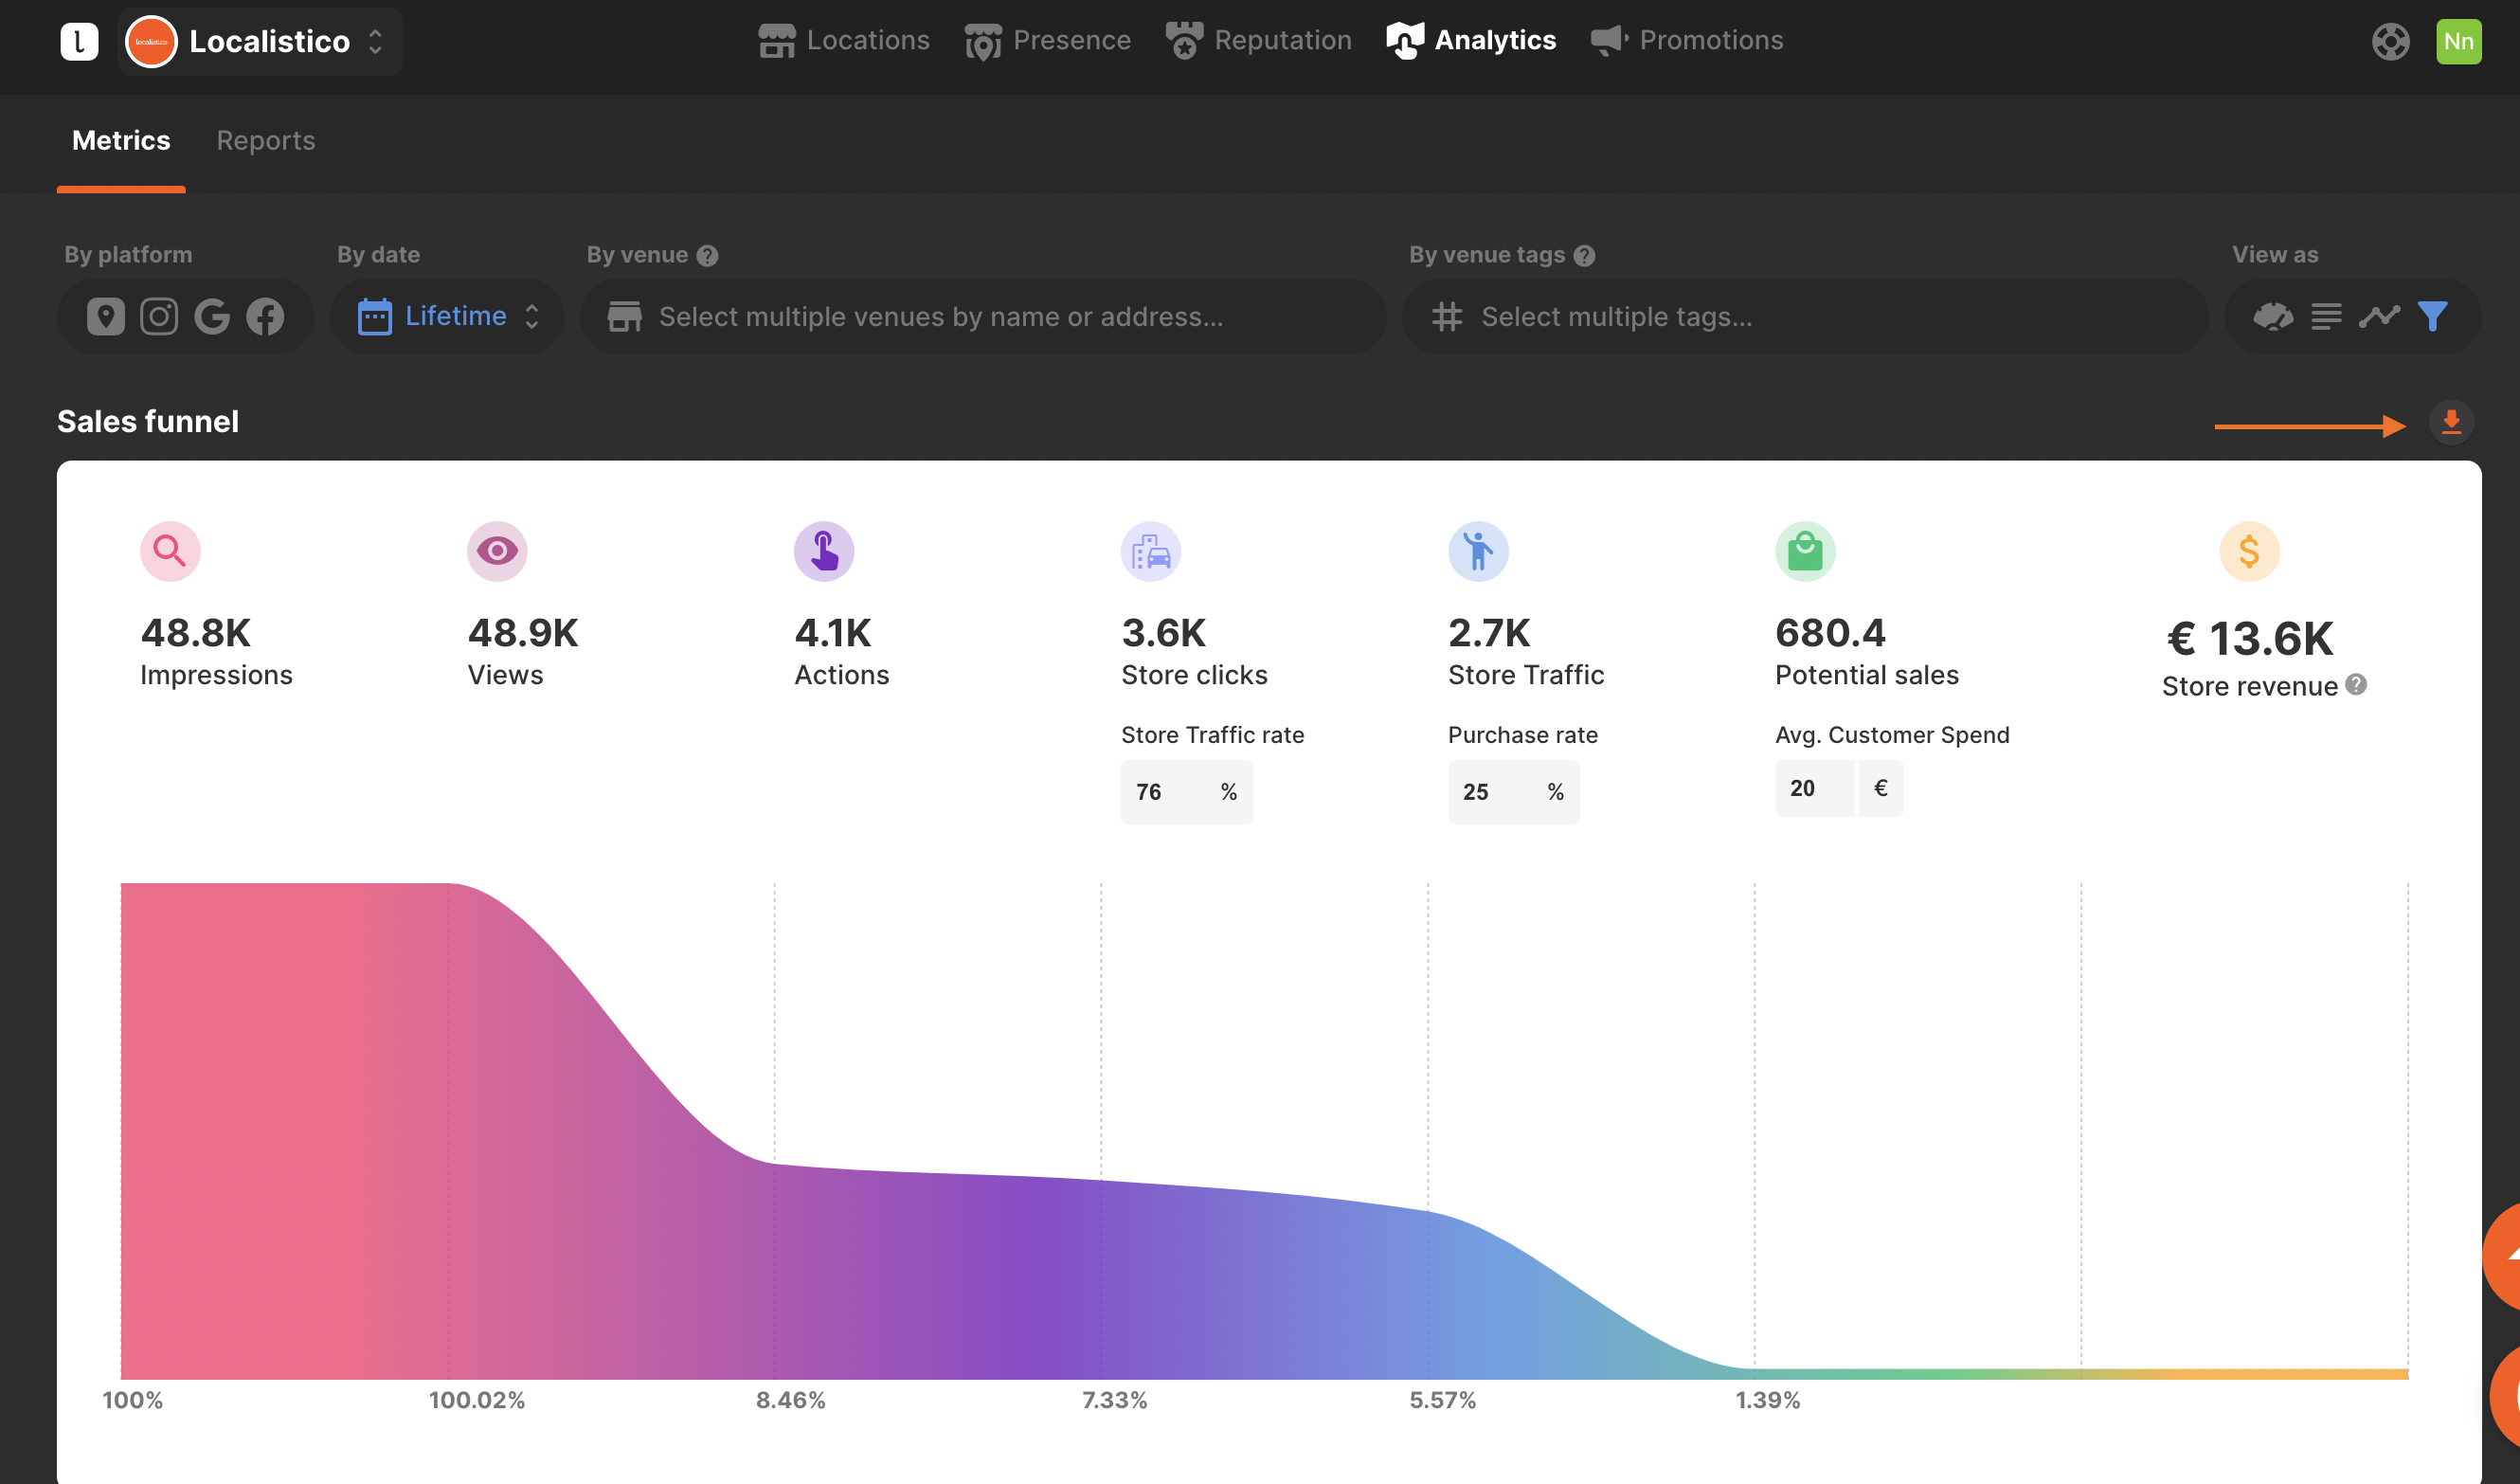
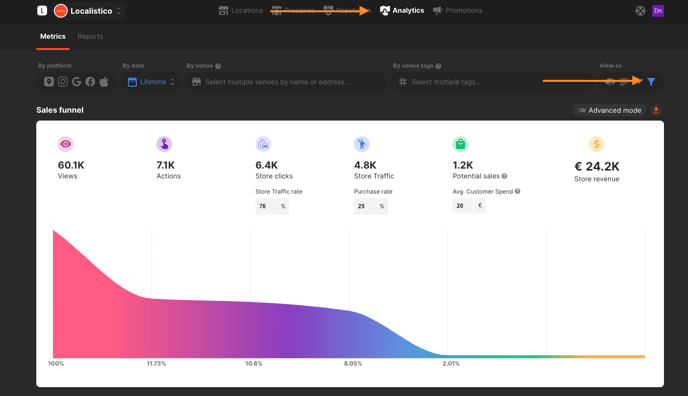
The sales funnel can be found under the Analytics tab in Localistico. From the metrics tab on the right-hand side, you can access the sales funnel by clicking on View as sales funnel
Which metrics are used to calculate the estimated store revenue?
Store views
Views are the number of times your business has been viewed by people, regardless if there was a previous search or not. The profile can appear while the user browses a search, map or opening the link from any other source.
Actions
Total number of actions a customer took once they found your business, for example click on to "get the directions" or "click to call".
Store clicks
Store clicks are the total number of high intention actions a customer took with a view to visit the store. For example: making a call, looking up the address on maps or making a reservation.
Store traffic rate
Google benchmarks that 76% of customers performing a store click will visit a store within 24 hours. This % can be updated individually if you want to apply a different figure based on your business.
Store traffic
Applying the Google benchmark that 76% of customers performing a store click will visit a store within 24 hours, the amount of customers visiting the store will be estimated.
Purchase rate
The purchase rate is the average in store conversion rate. This percentage has to be updated based on the actual in store conversion rate for your business. In other words, this is the percentage of the people who actually make a purchase when they enter one of your businesses.
Potential sales
The potential sales metric represents the estimated sales based on the store traffic and the purchase rate. This metric is calculated with Store Traffic x Purchase rate.
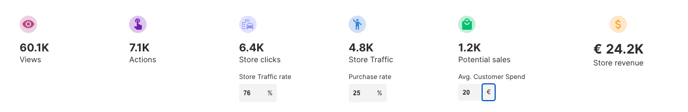
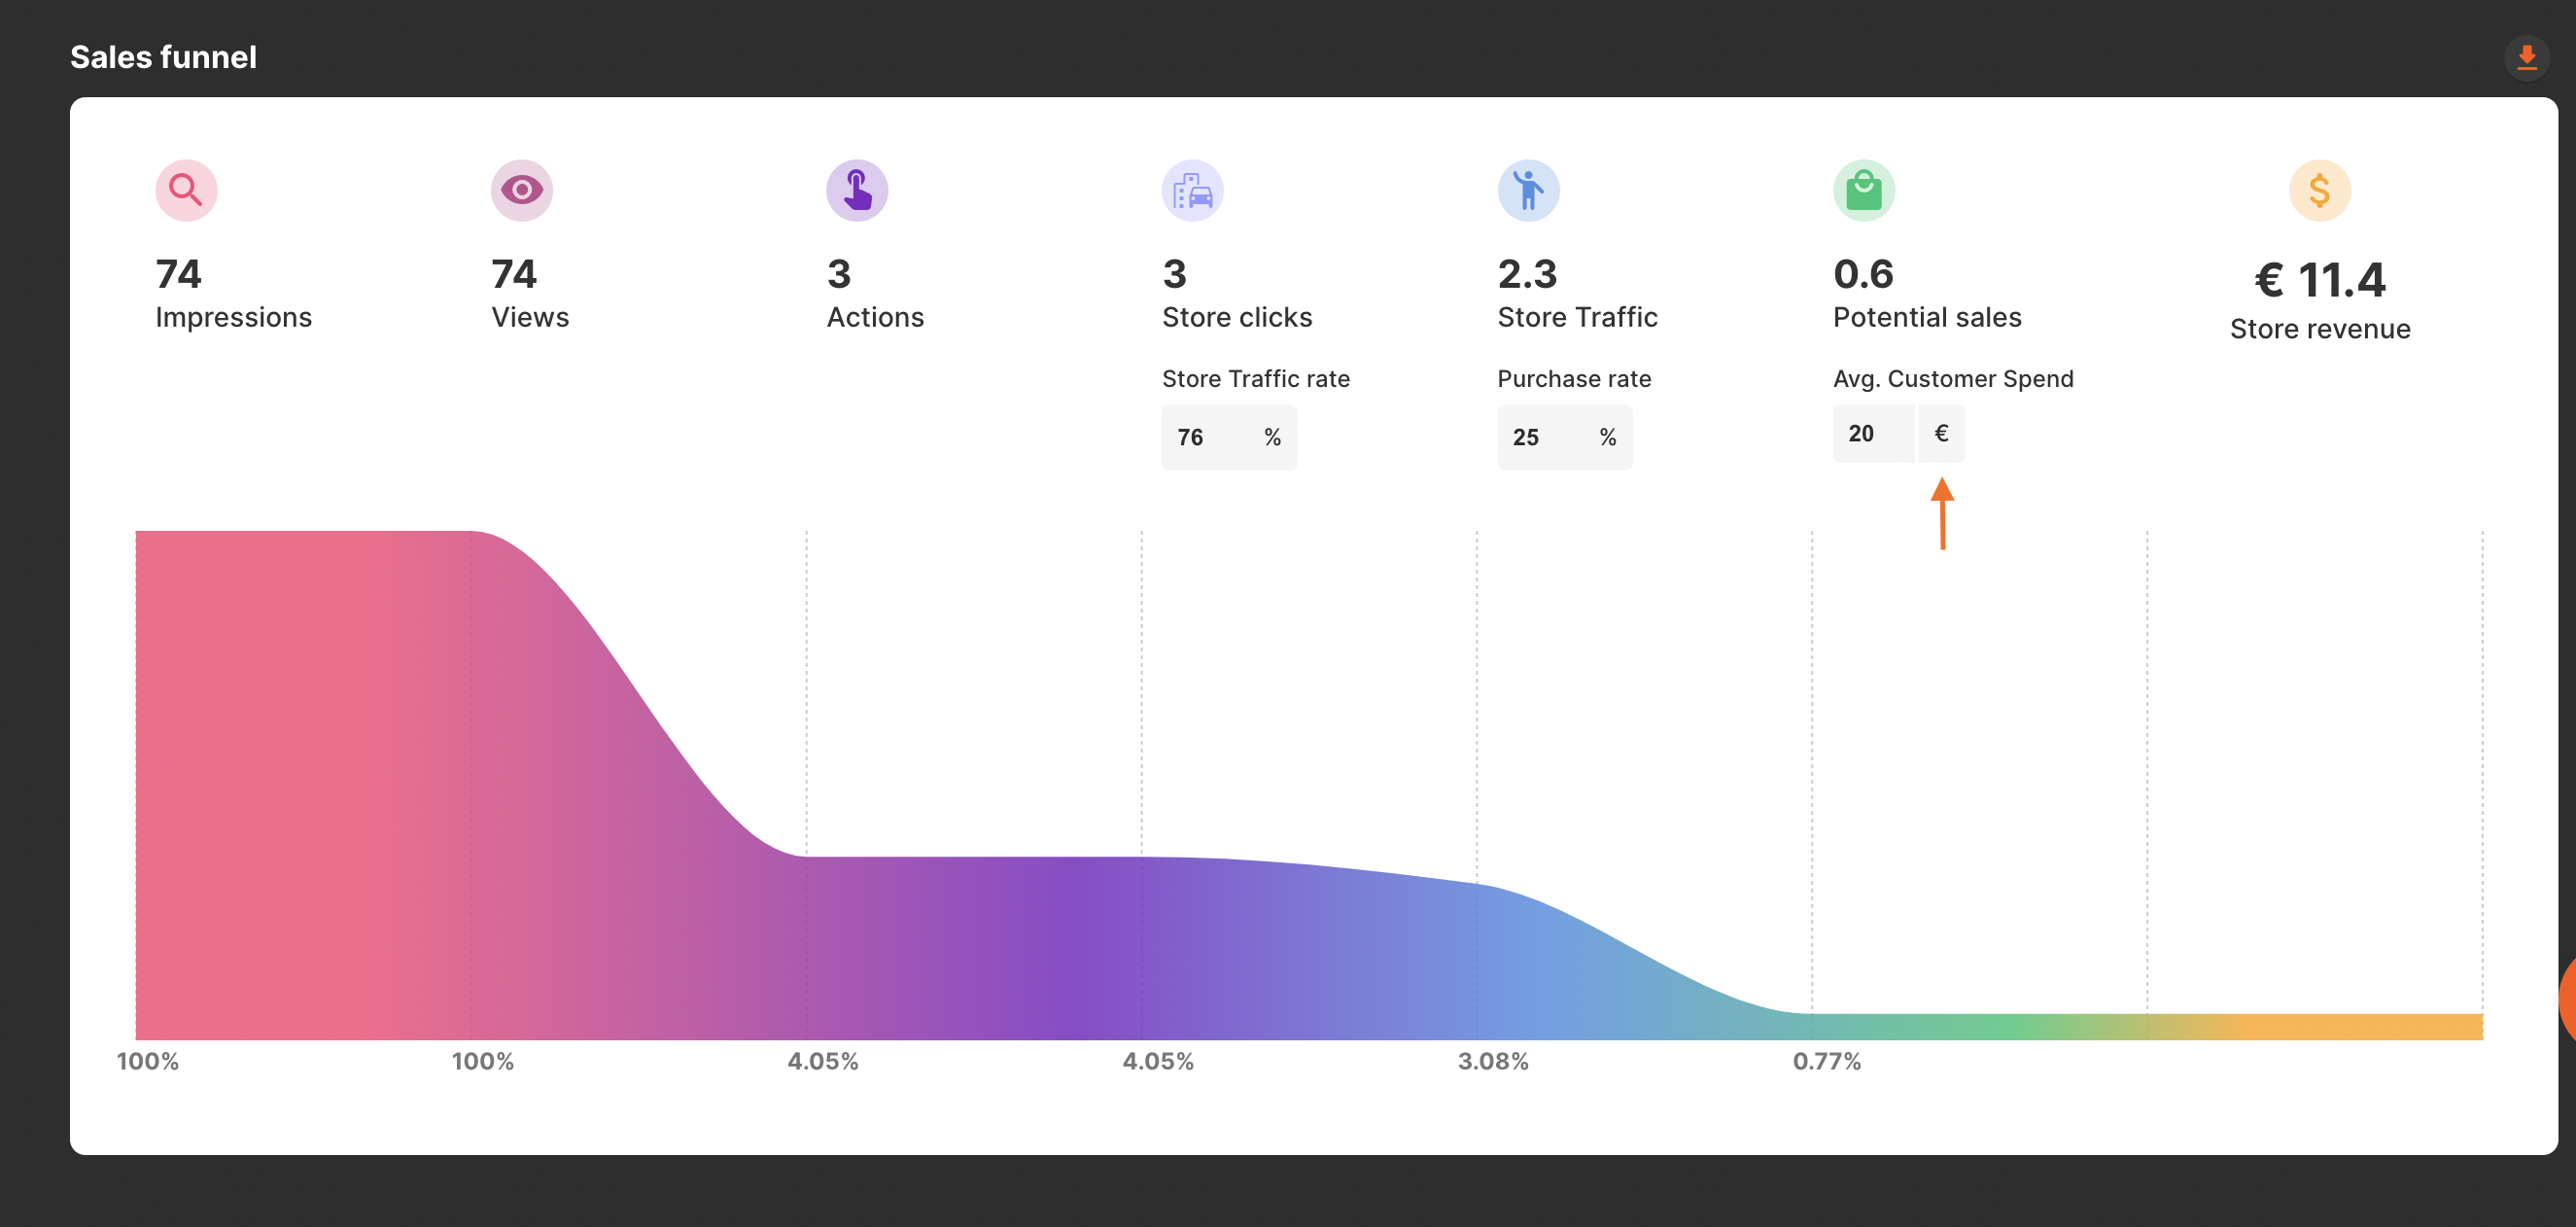
Average customer spend
This amount is the average spend that a customer spends in store per visit. This figure has to be updated based on the actual customer spend for your business. The currency can be changed by clicking on the currency icon:
Store revenue
The store revenue is the estimated revenue based on the potential sales and your average customer spend in store. This metric is calculated with Potential Sales x Average Customer Spend.
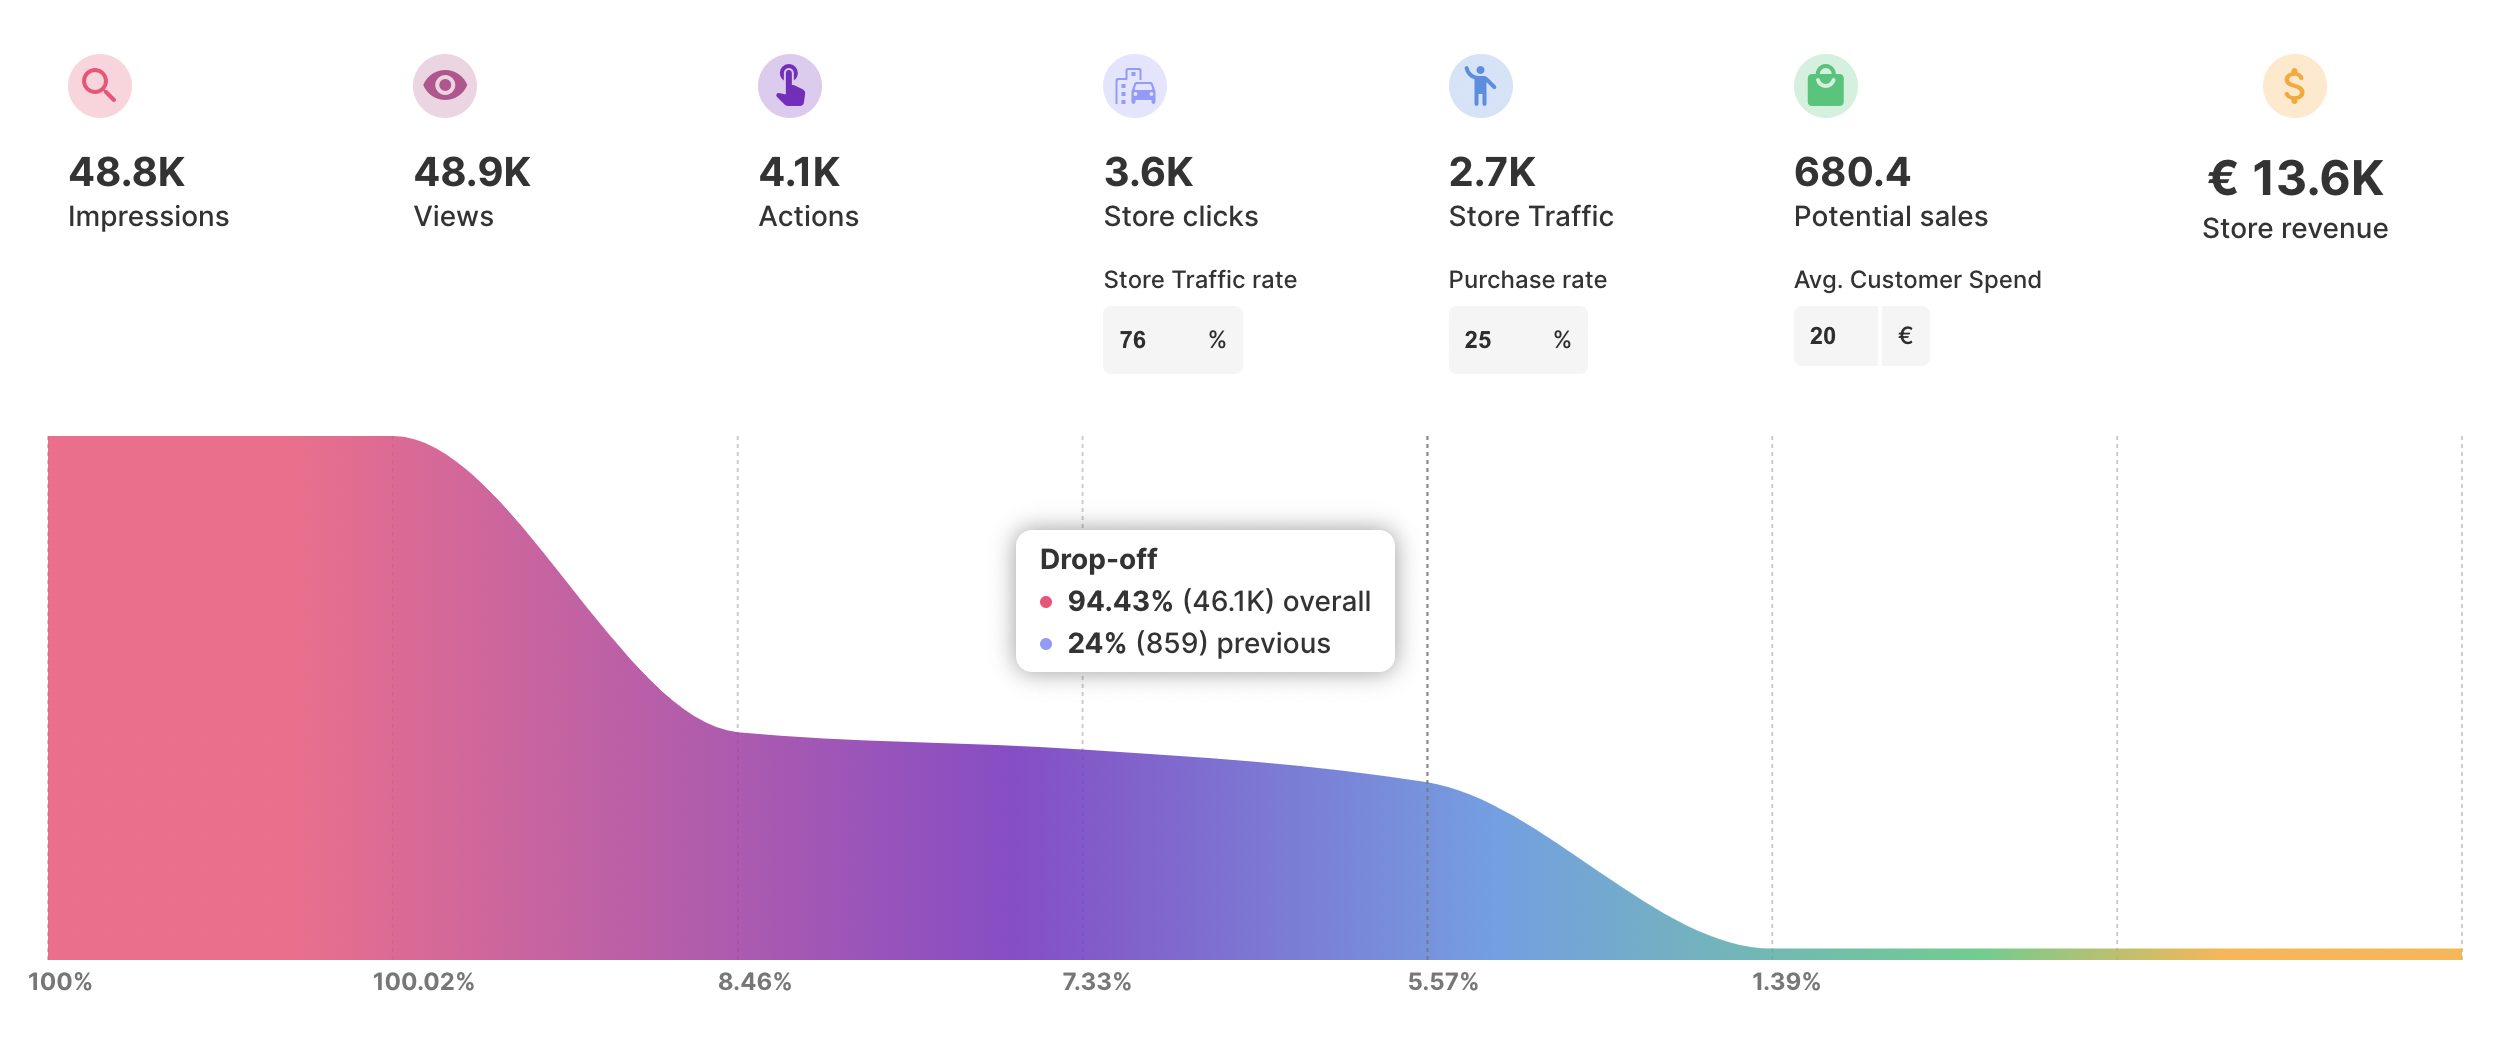
The graph below the metrics represents the whole customer journey and shows the drop-off of customers during the customer journey. In the following example, the customer journey starts with a high number of users (48,8K) searching and viewing the profile on Google, this number gradually decreases, reaching a drop-off of around 95% when it comes to in-store traffic, where around 5% (2.7K) of the users who initially visited the Google profile visit the shop within 24 hours.
The sales funnel can be exported to CSV by clicking on the orange button on the right.