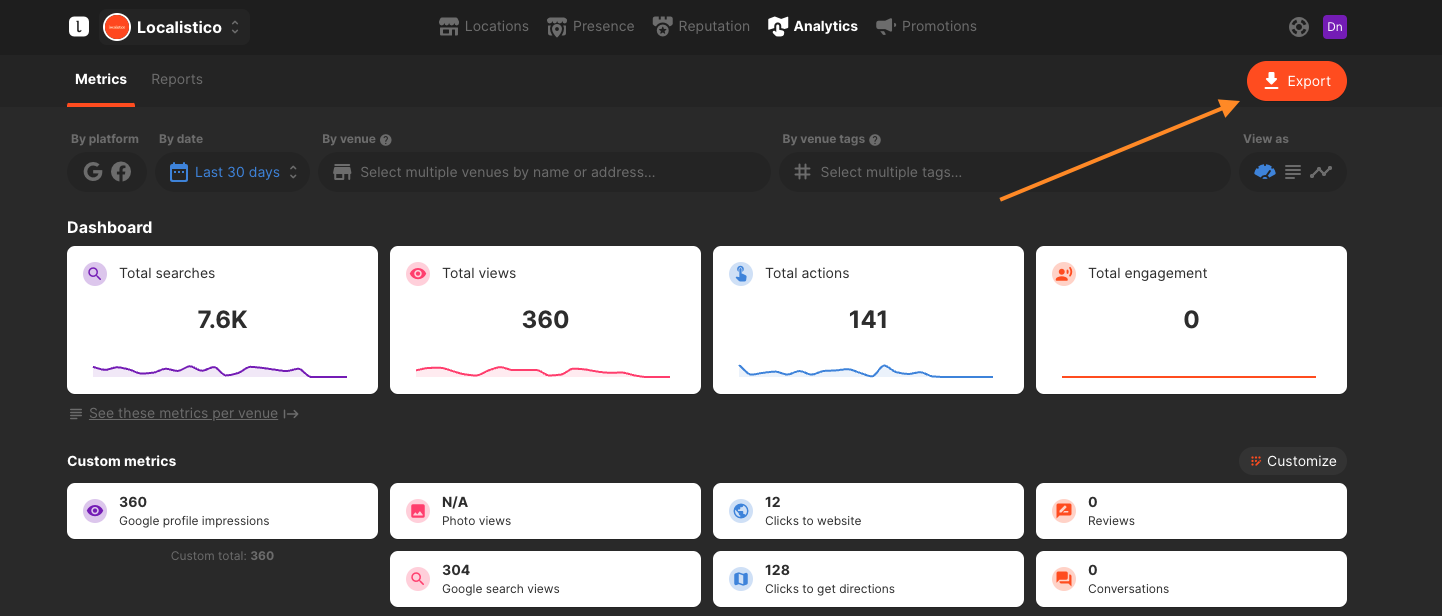
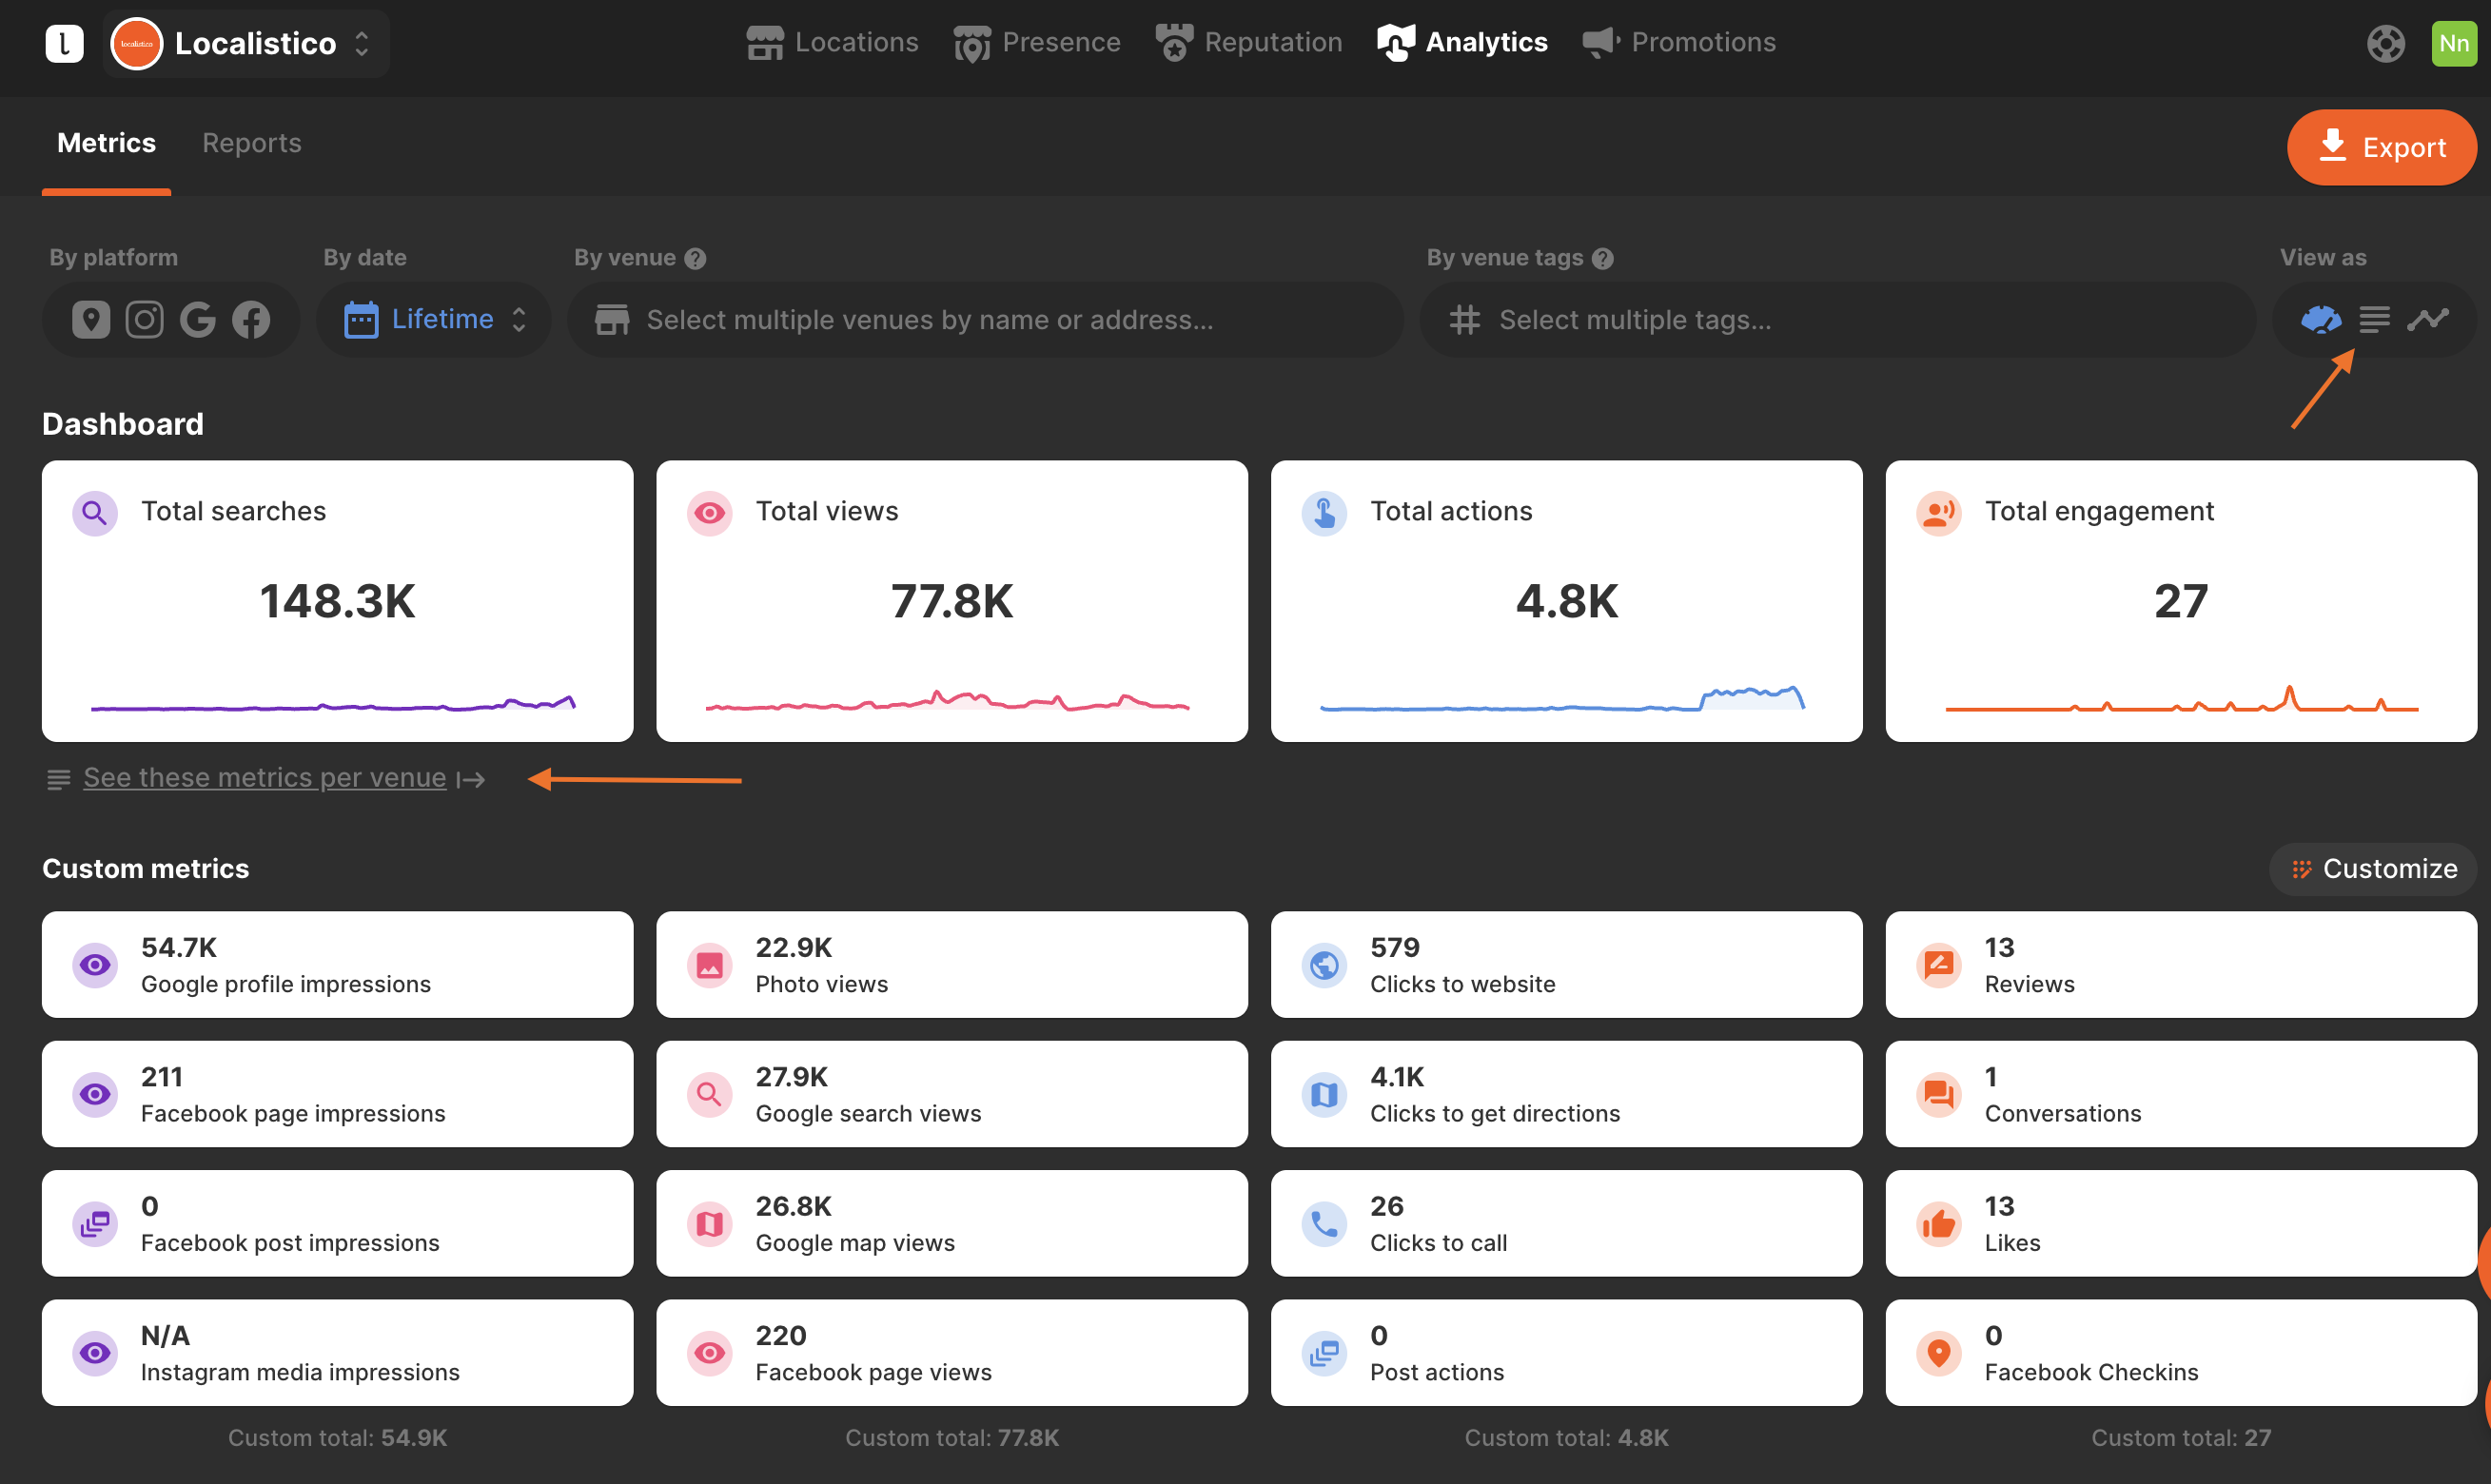
You can access your business's metrics by navigating to the Analytics tab in Localistico. This section provides valuable insights, such as the total number of views your location has received and the frequency of direction requests to your business.
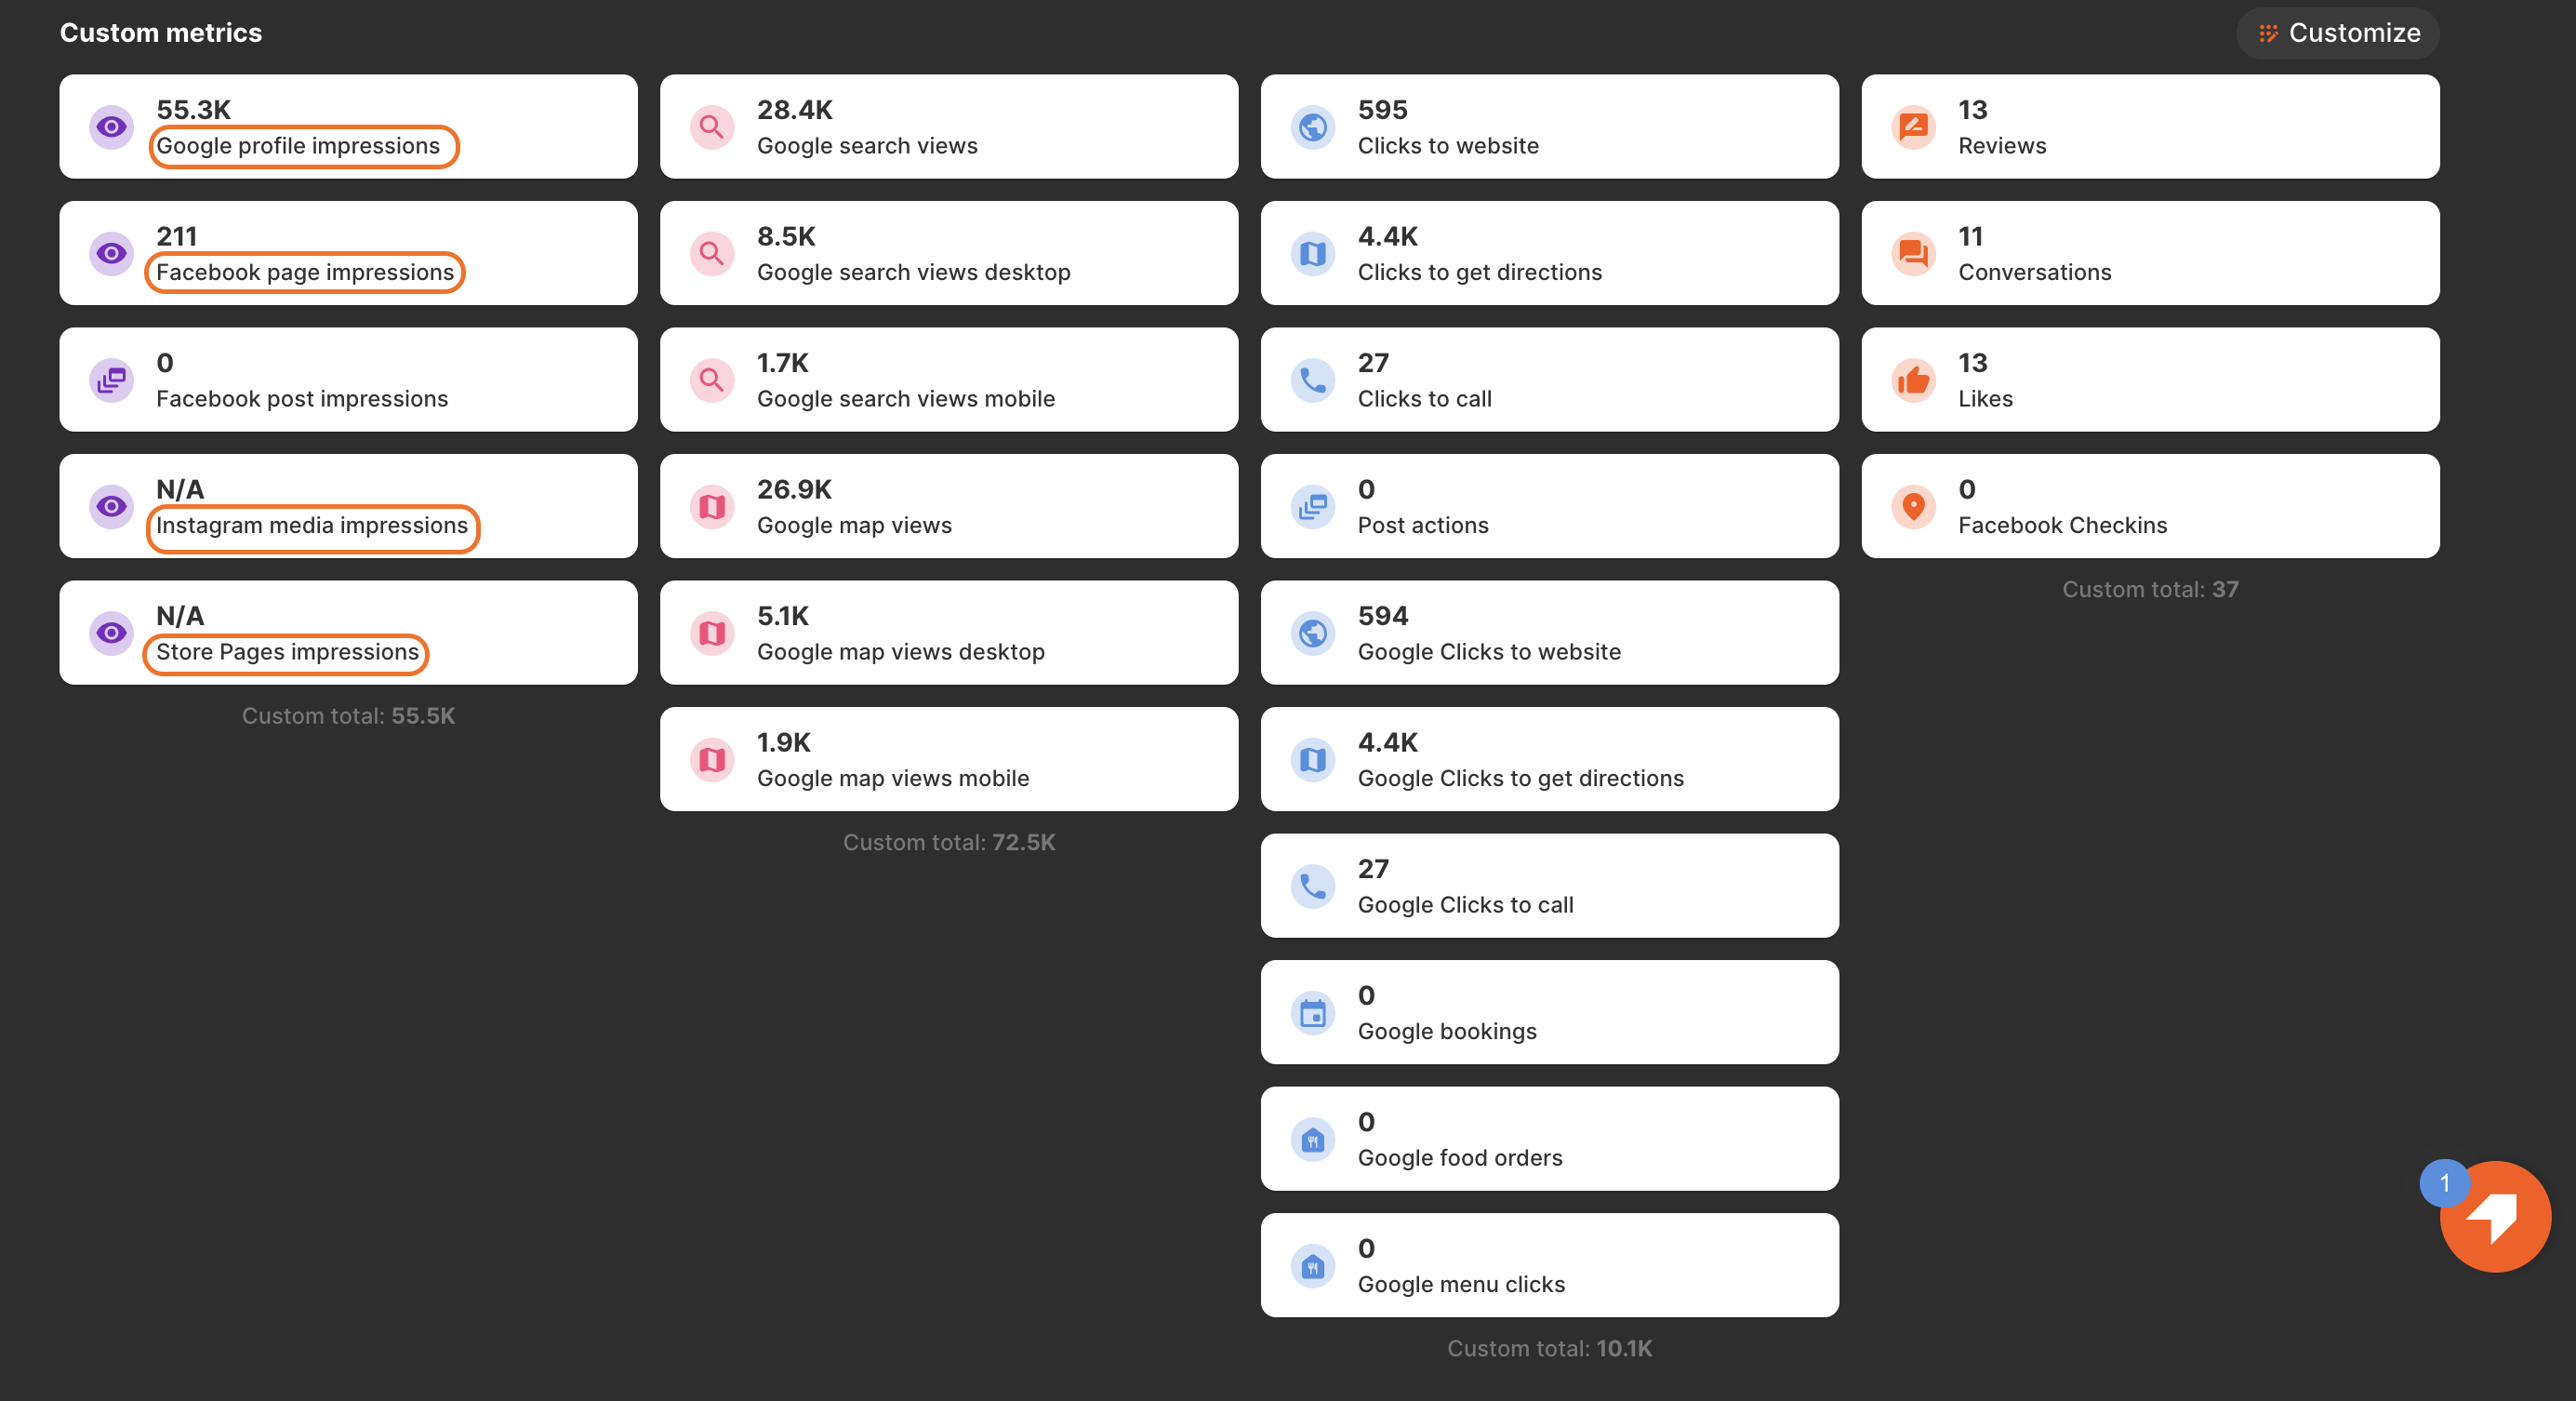
Metrics are currently available for Google, Facebook, Apple, Instagram, and Store Pages. You can choose to view metrics from a single platform or from all of them, allowing you to tailor the information to your needs. Remember that certain metrics may be exclusive to specific platforms, which will be clearly indicated alongside the data.
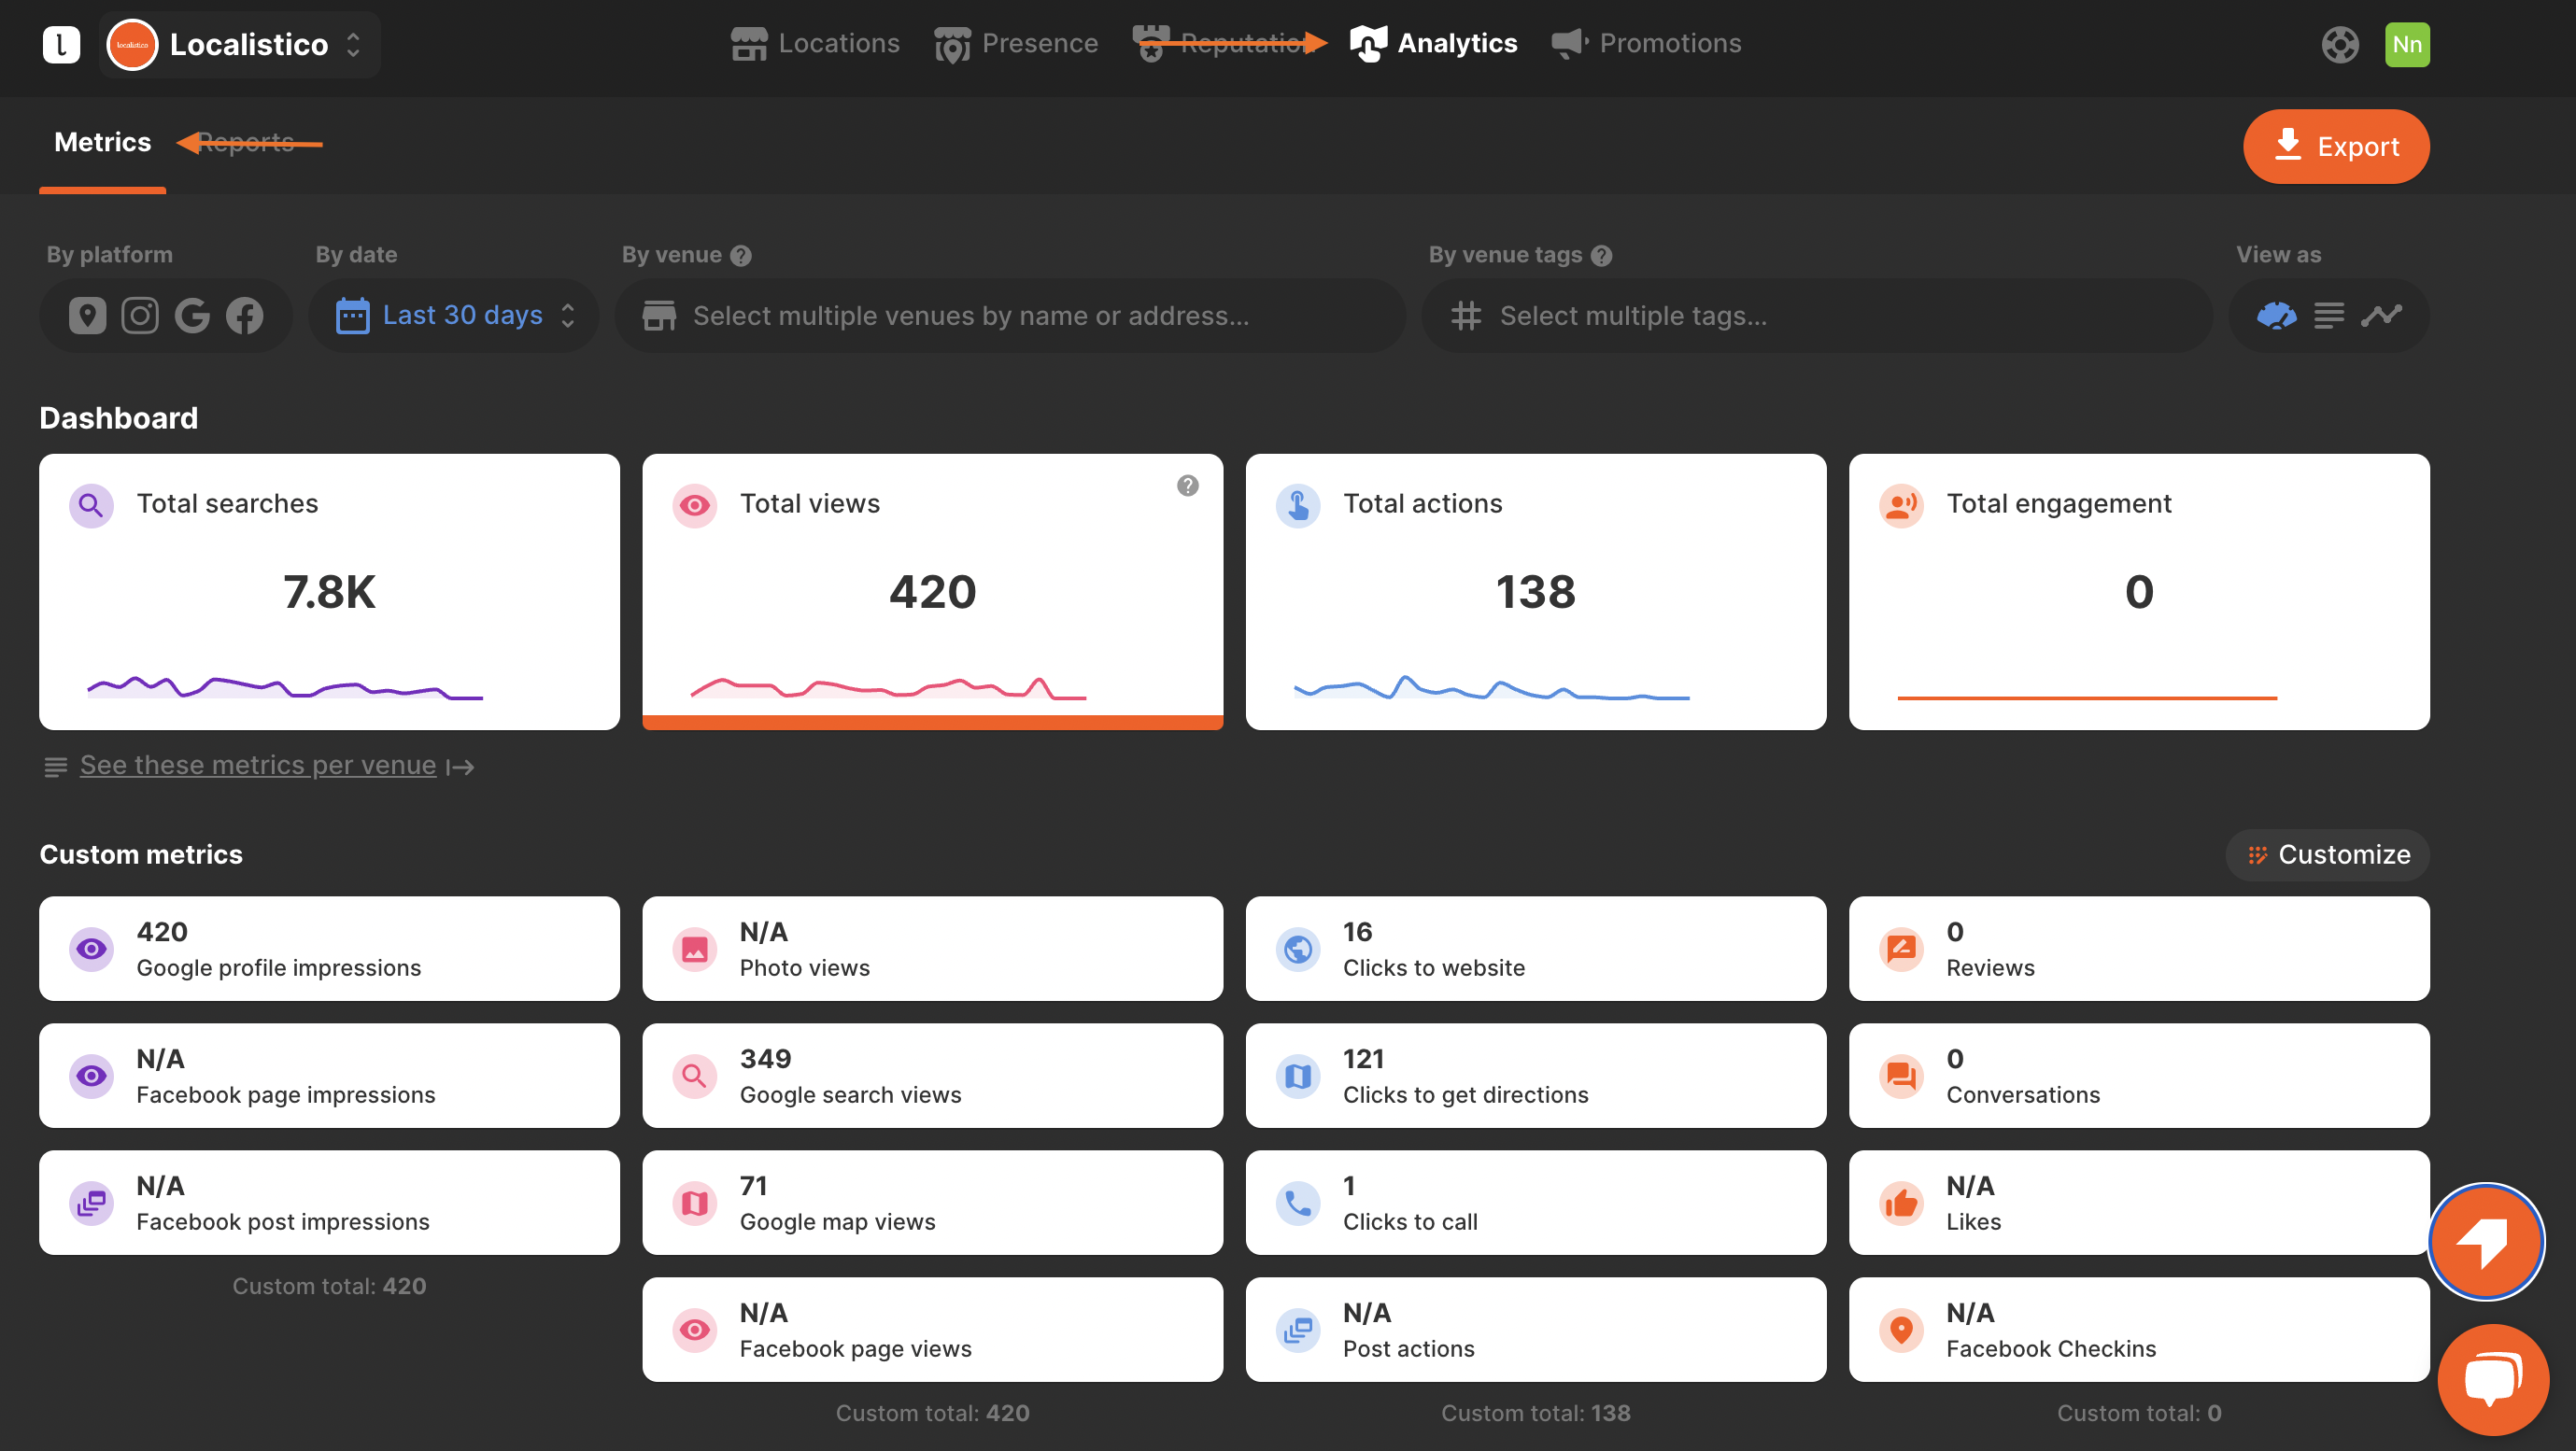
How can businesses filter metrics?
Localistico offers several filters so that you can obtain the information you need:
- Filter just metrics from the platform you want to analyze or select all platforms.
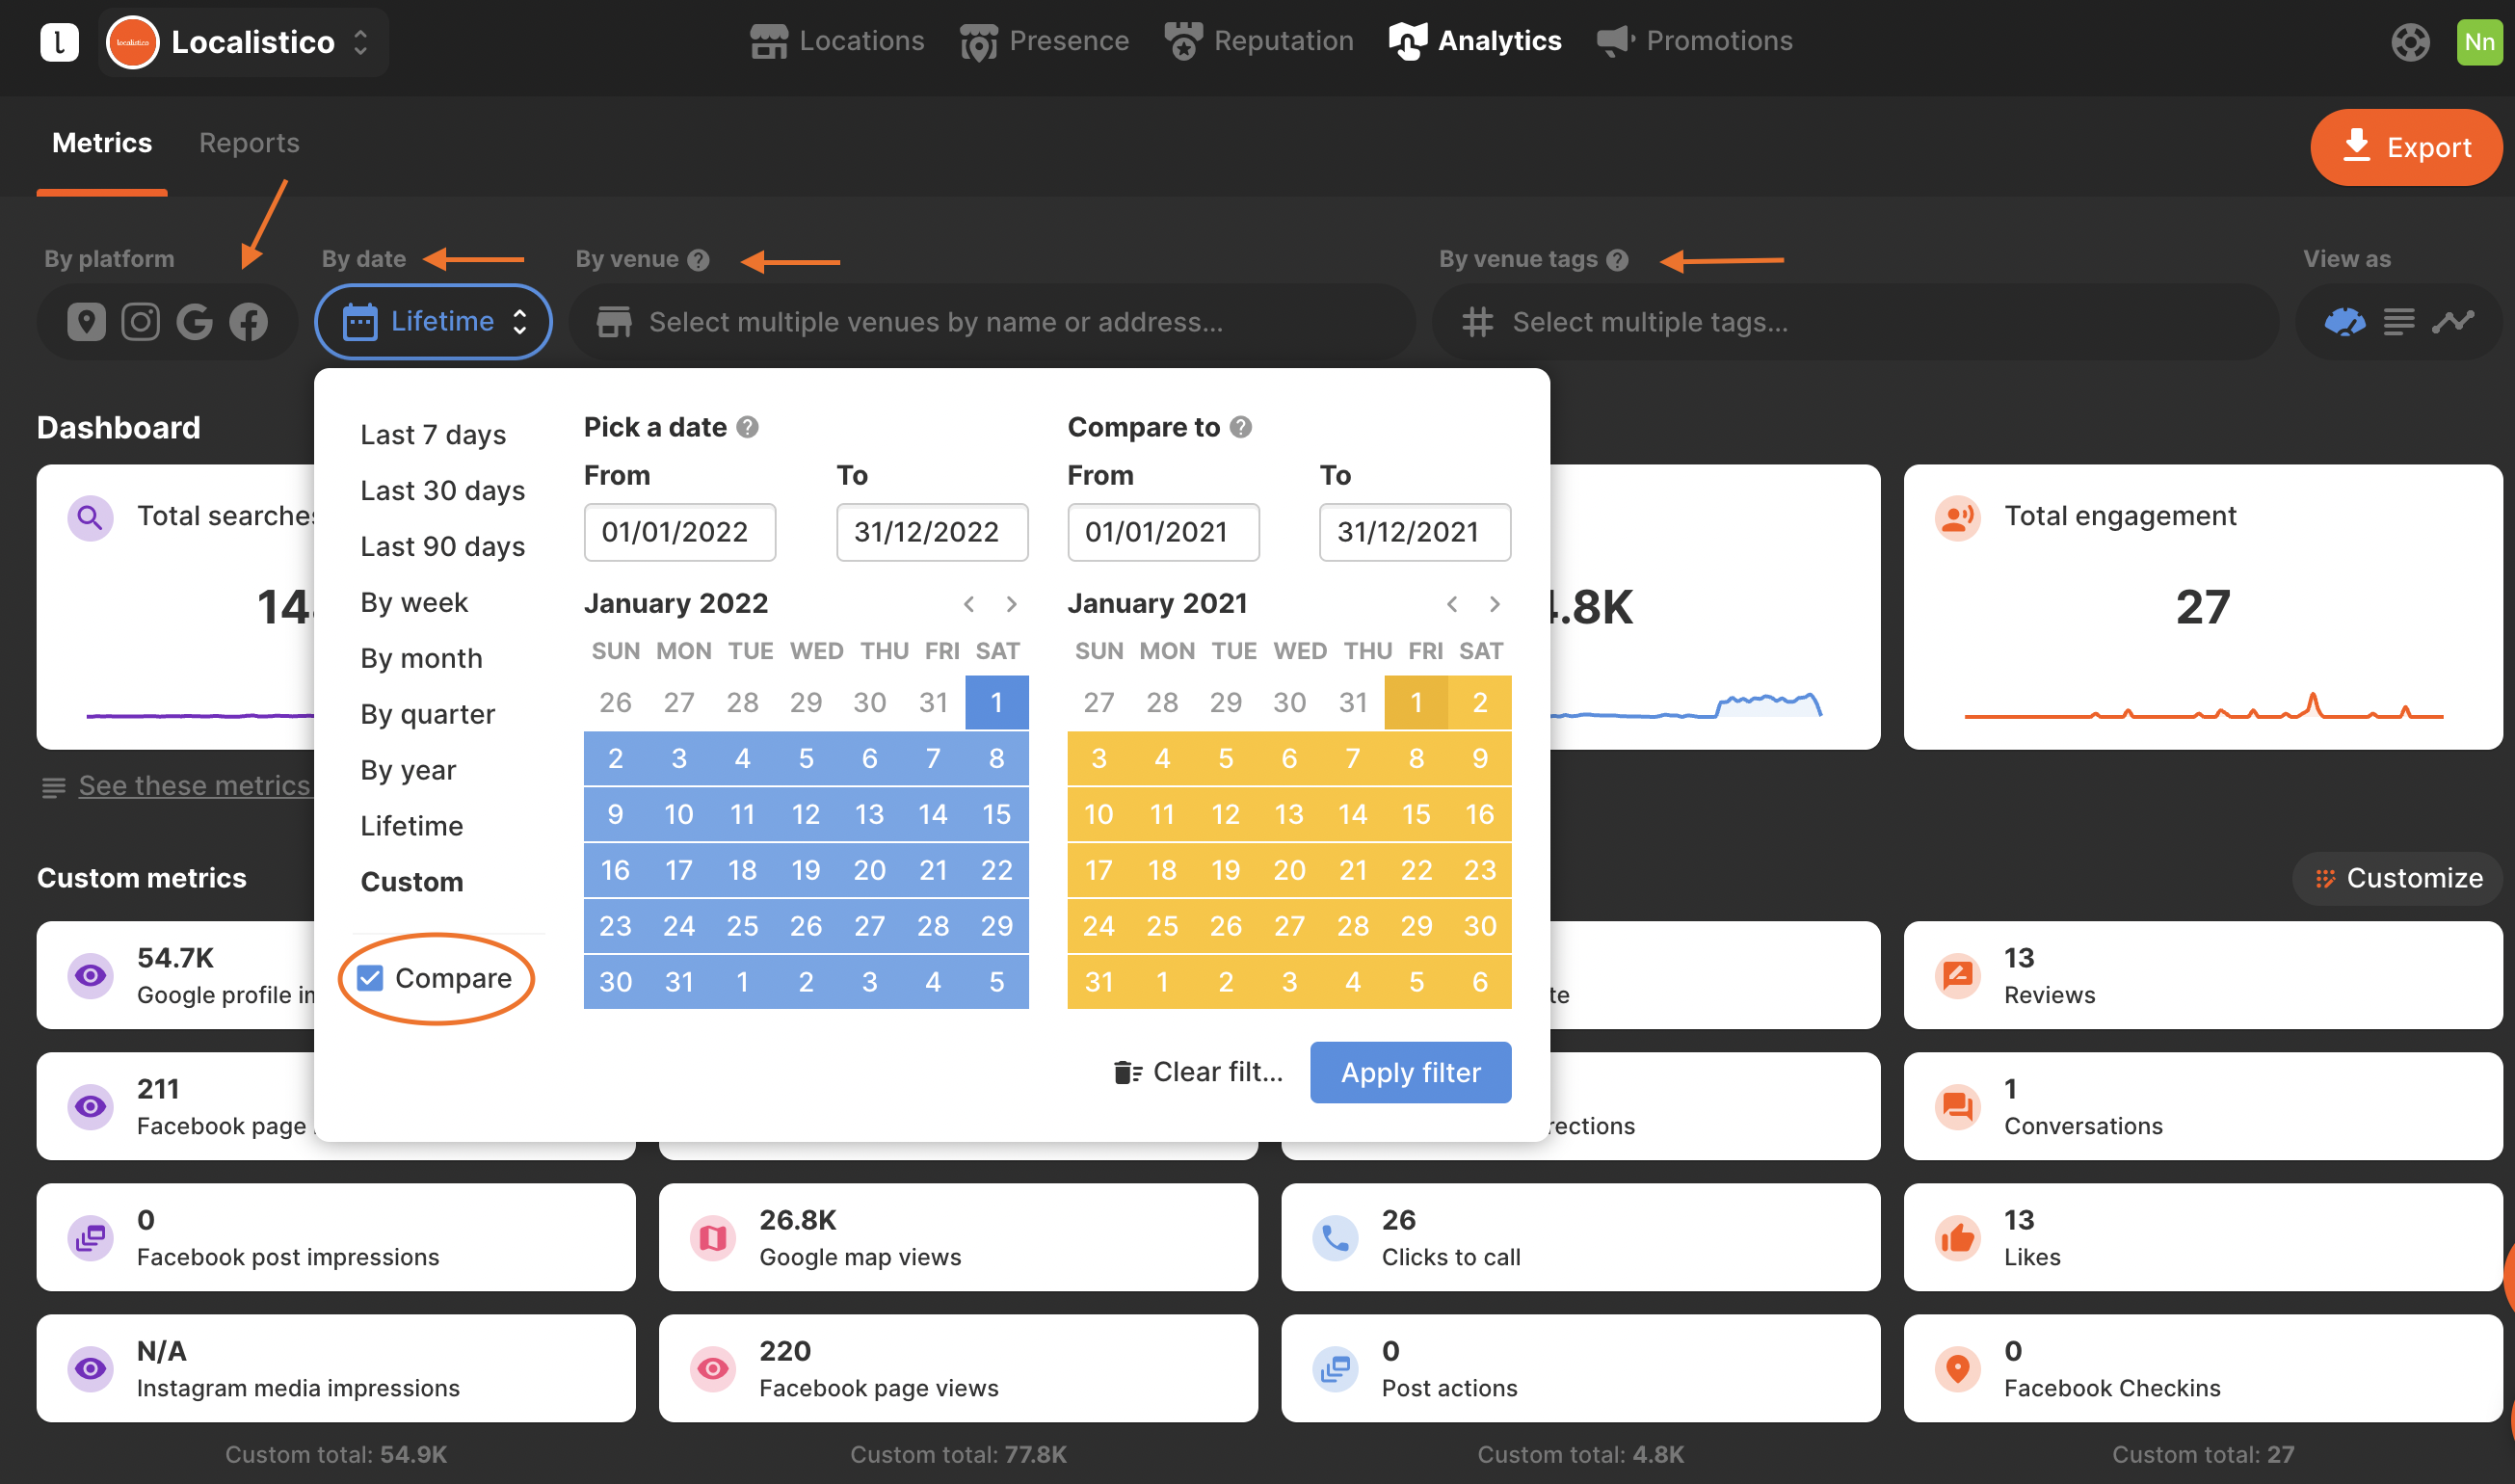
- Metrics can also be filtered based on timeframes. Businesses can choose from predefined periods or set a custom range that suits your analysis needs. Additionally, businesses have the option to compare two distinct periods, allowing you to assess how your metrics have evolved over time.
- Users can filter by venue and see the customer actions related to a specific venue.
- If you have added tags to categorize and group your venues, you can filter metrics based on these tags. You can find out more information about adding tags here.
How can businesses identify trends?
Users can examine trends in their metrics by clicking on the trends button and selecting up to 8 specific metrics for analysis. This selection process does not alter the existing dashboard configuration and will not be stored permanently. Additionally, the URL for the trends dashboard serves as a saved view that can be easily shared with team members for collaborative insights.
How can businesses see metrics per venue?
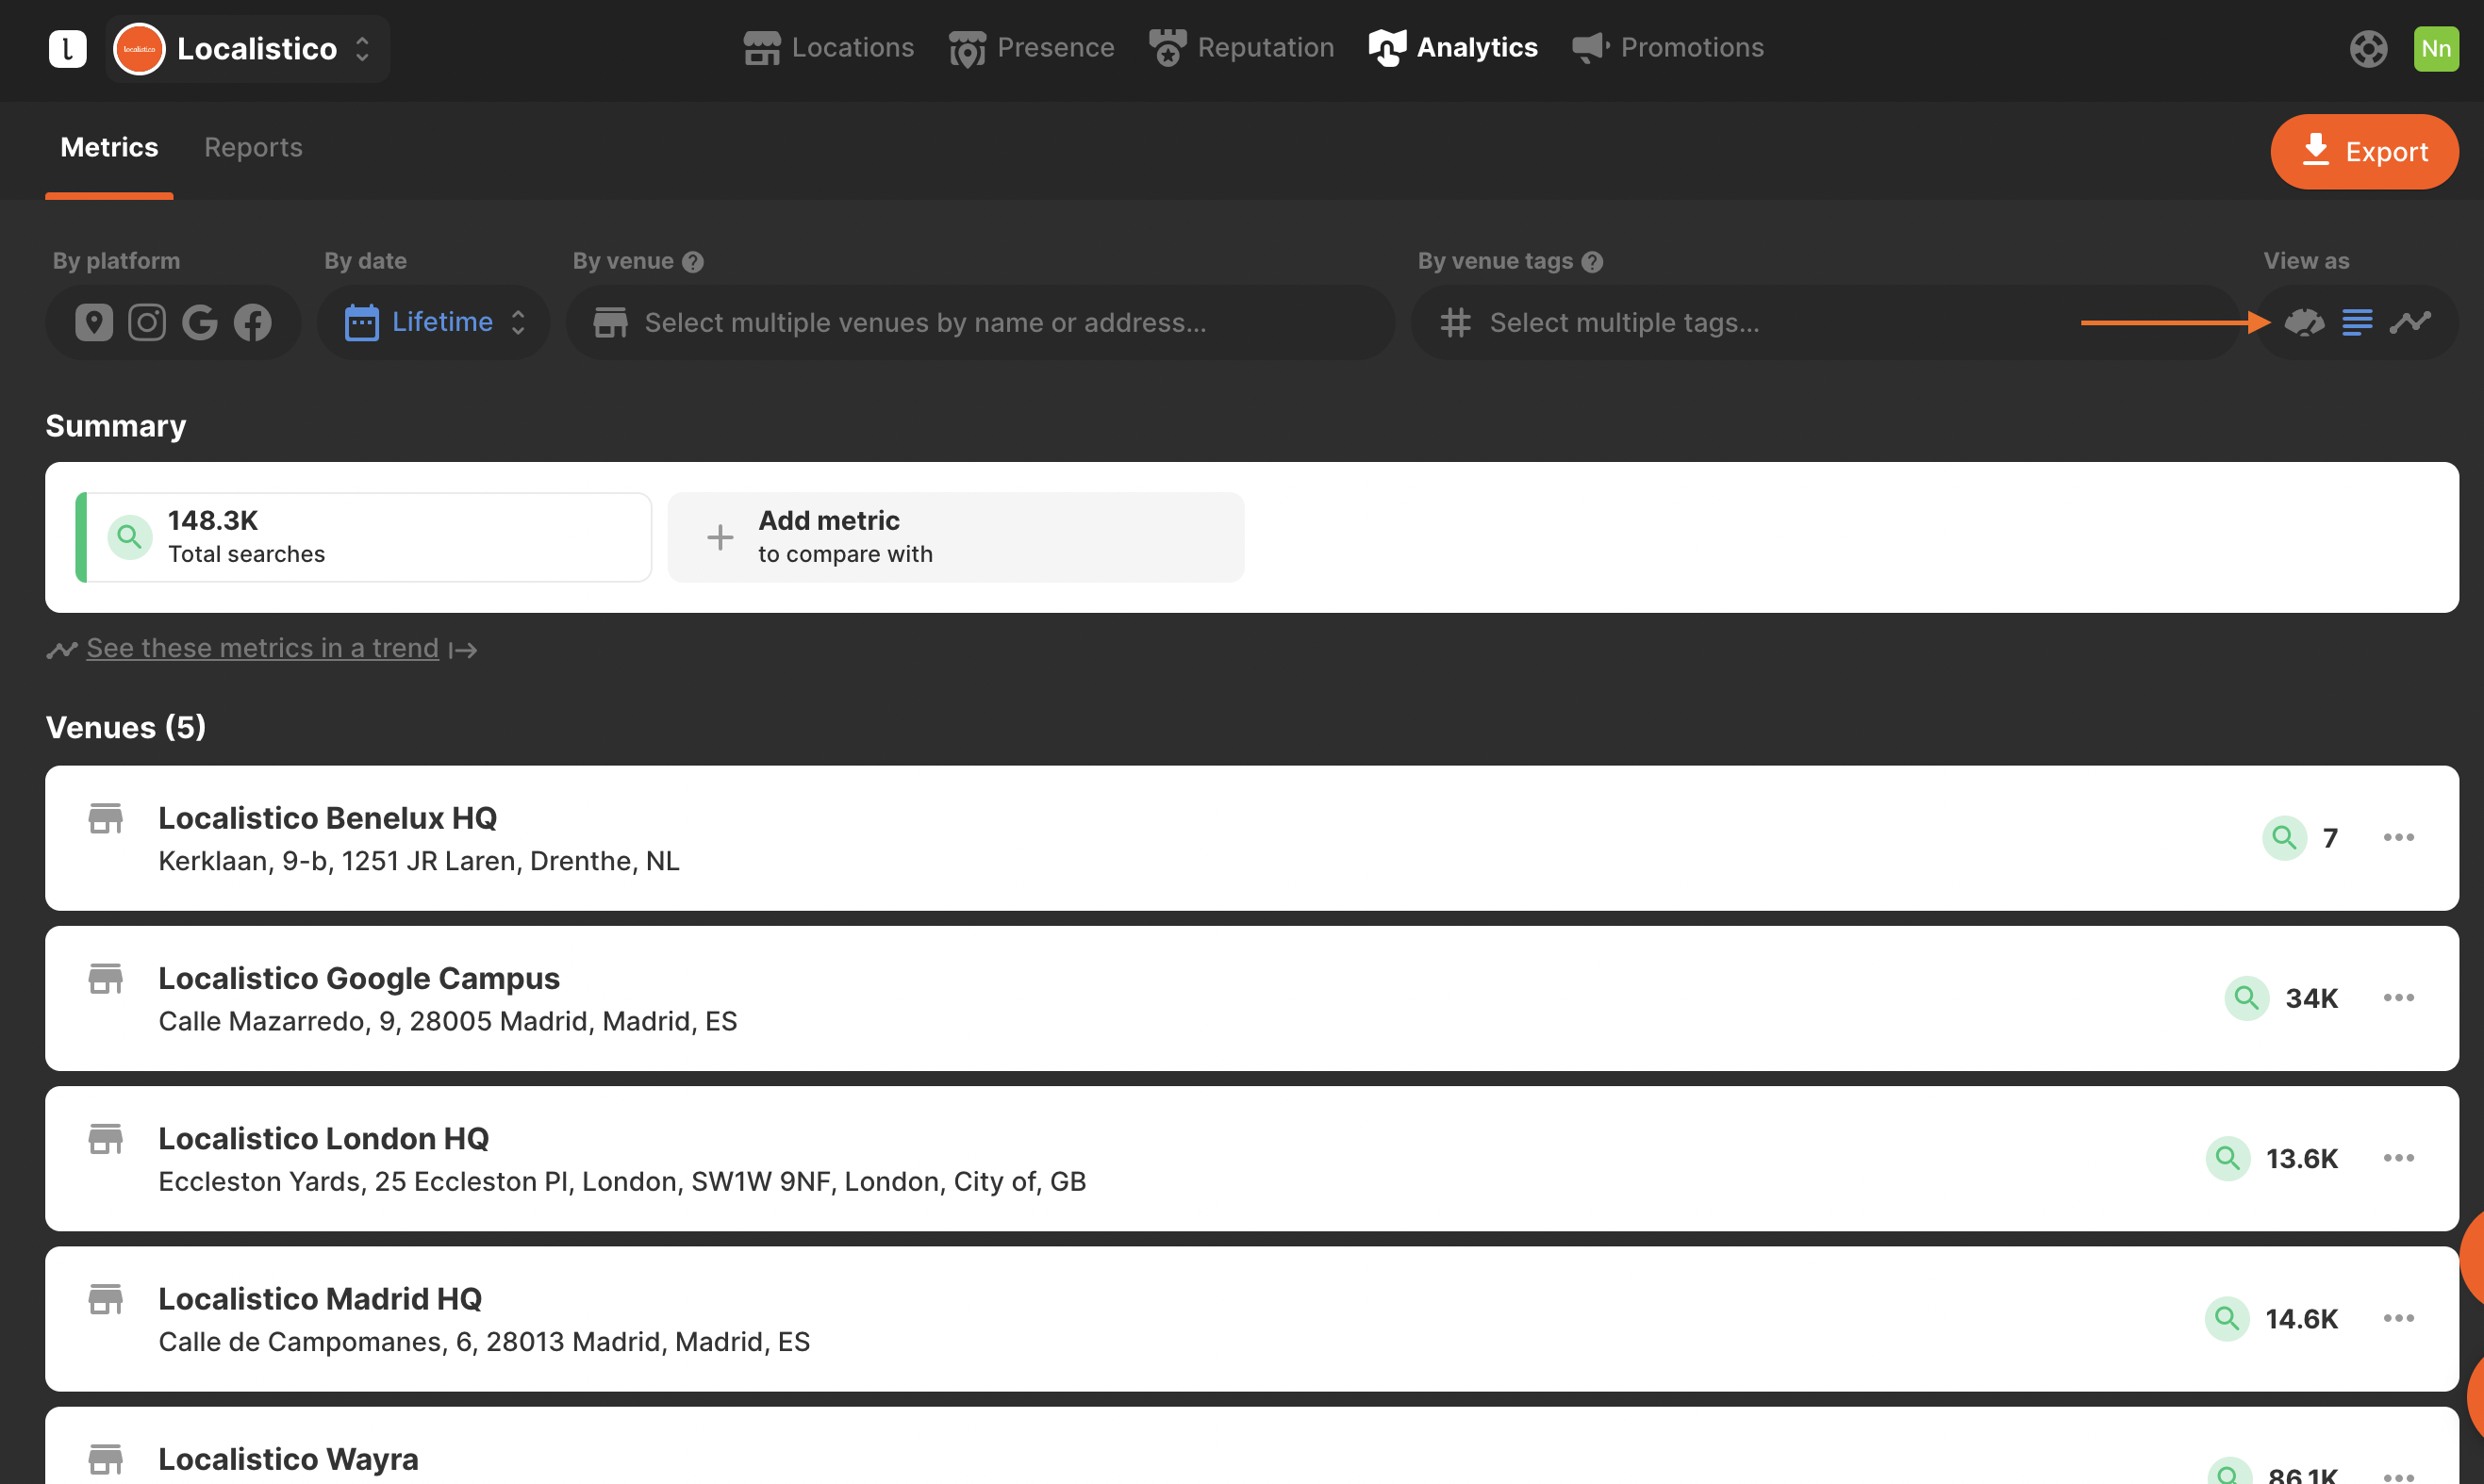
In order to see the metrics per venue, click on view as a list or see these metrics per venue.
 The metrics per venue are available on a separate tab. Click on view as Dashboard if you want to go back to the overview of the metrics.
Please note that Google metrics will be fully available within the last 7 days. For example, as of 23 May, you should have metrics until the 17th of May.
How can I turn the metrics into a report?
Let's have a look at one example, our company would like to see how its Spanish units have improved their metrics in 2019 compared with 2018. (It's always recommended to compare two similar periods to obtain correct data. If you compared Q1 2020 with Q2 2020 you may notice some changes that are related to the season, not to the actual improvements in the data and your marketing efforts.)
To obtain this data, we should:
1. filter the venues that have been assigned with the tag "Spain". If you don't know how to assign tags for the venue, please have a look at this article.
2. select if you would like to obtain data only from Google or all platforms
3. select the periods you would like to compare and click on apply:
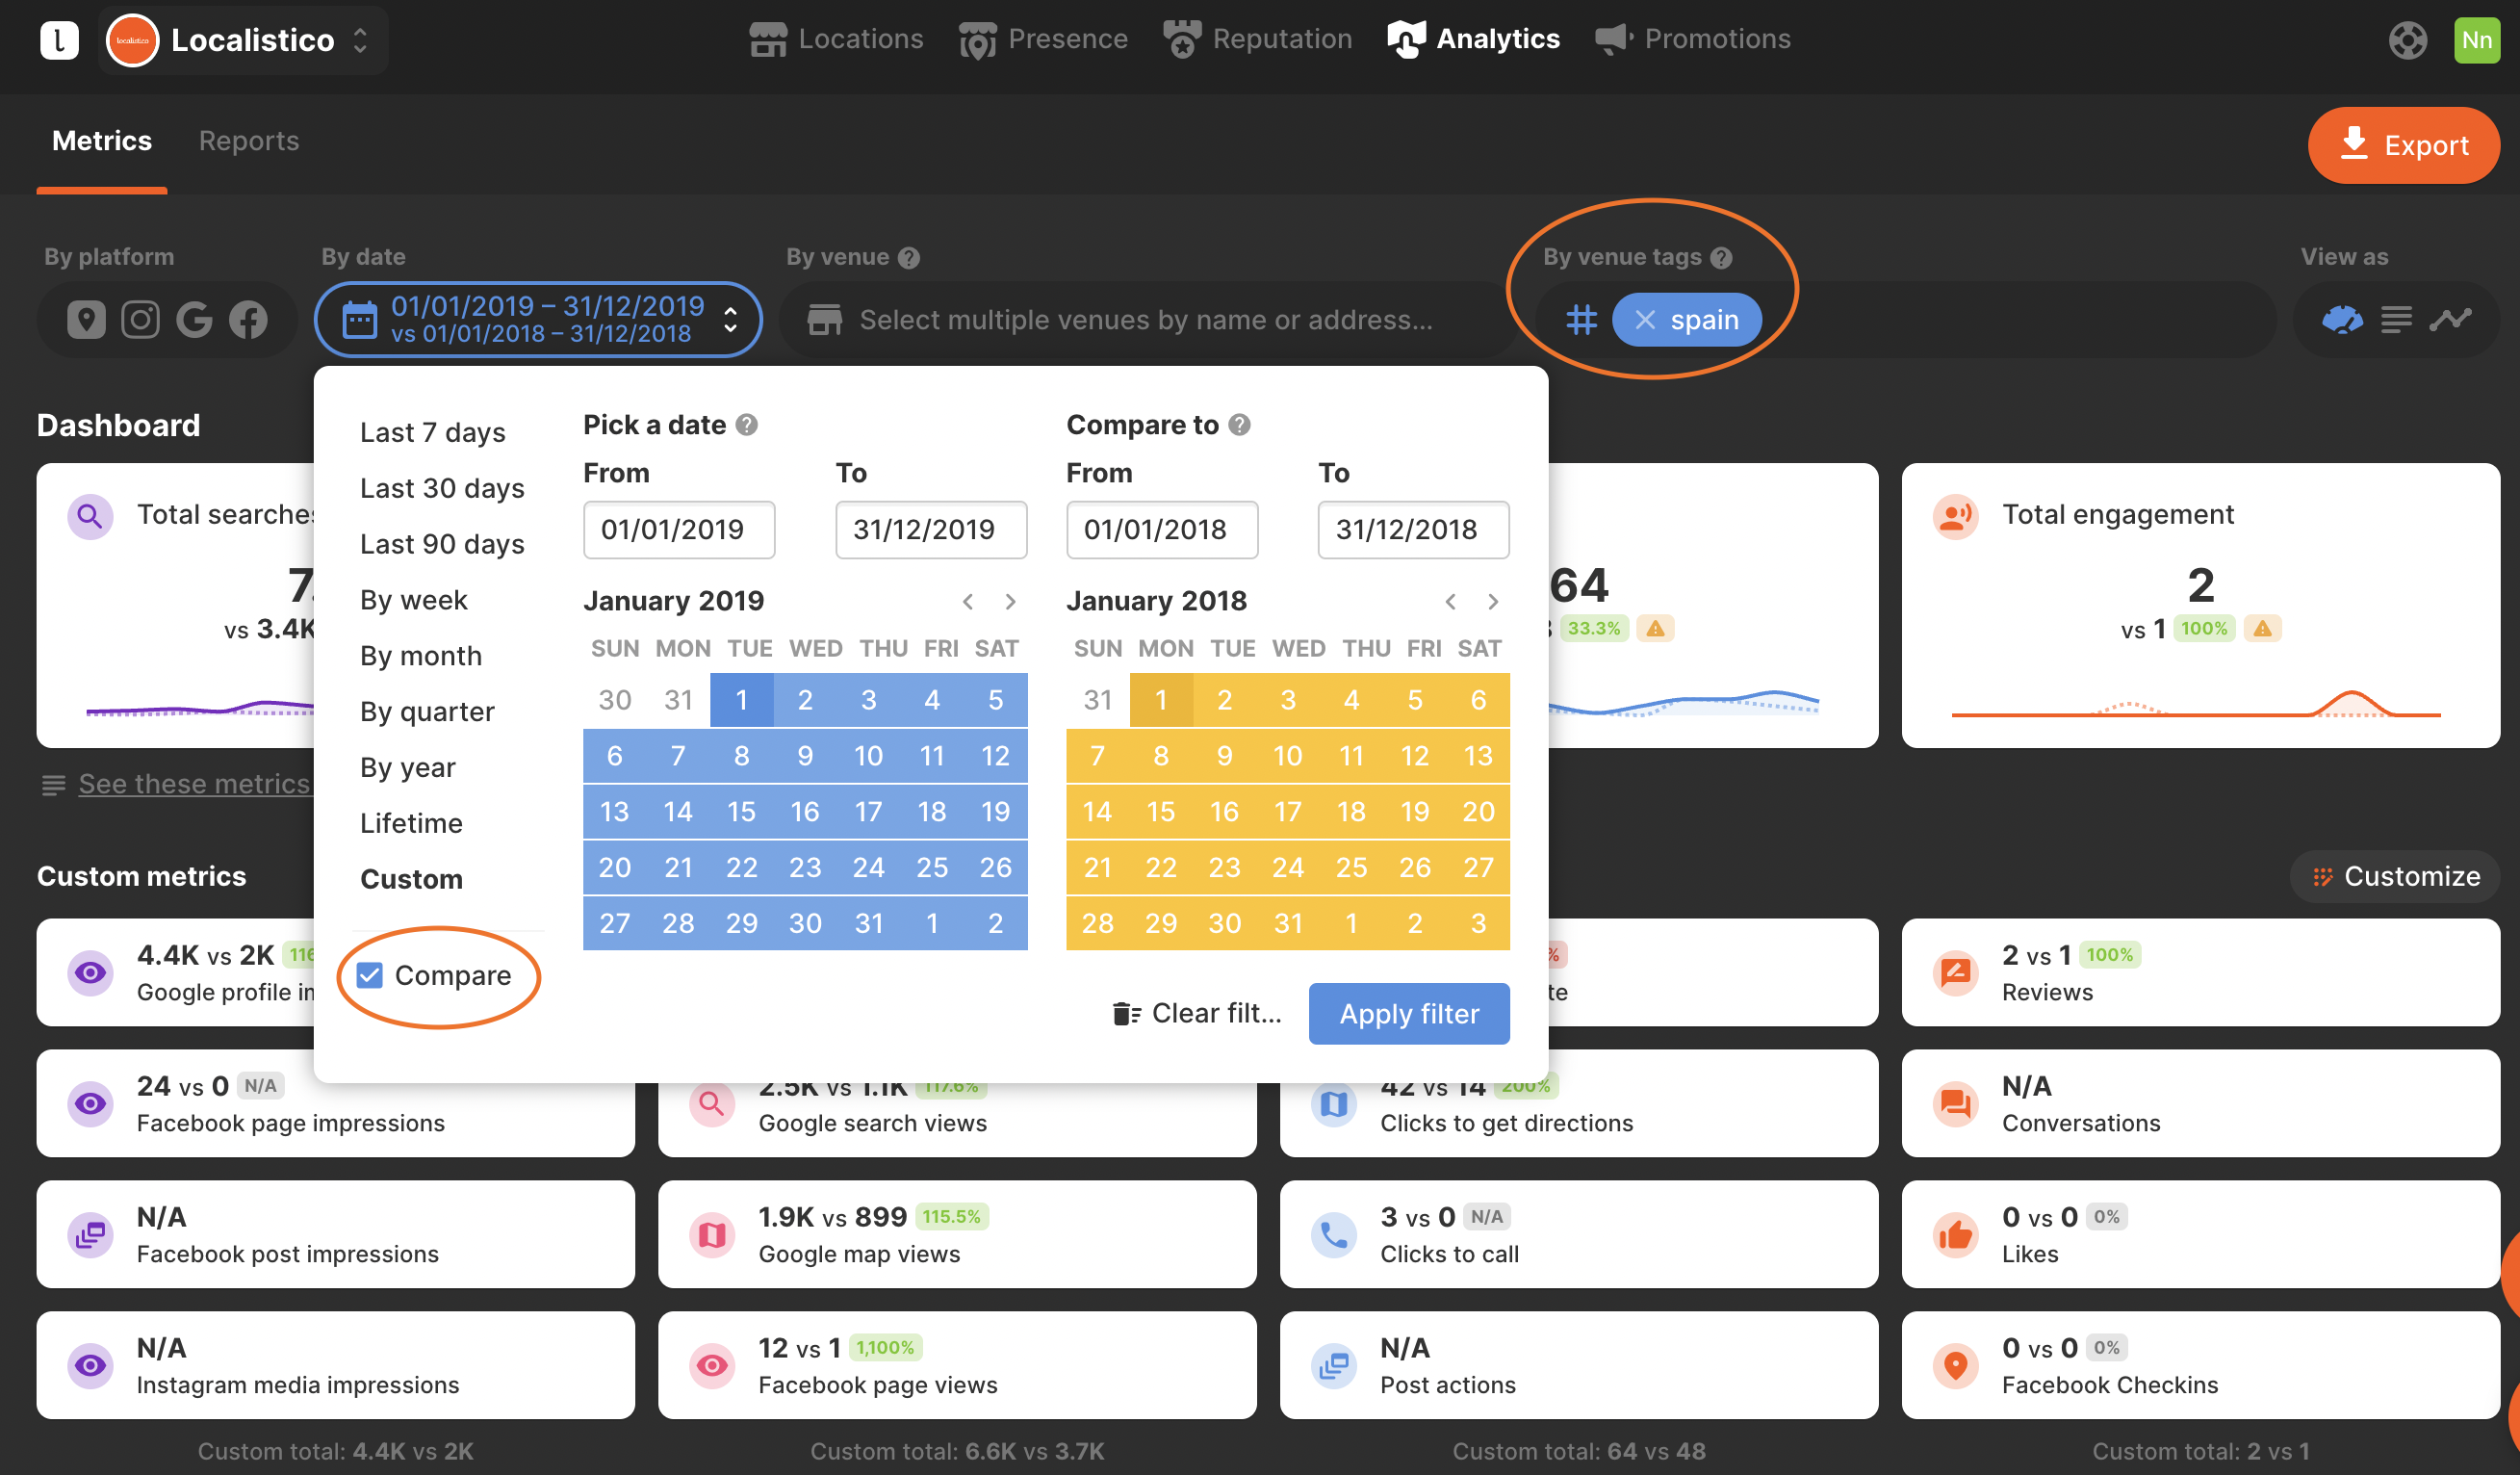 Localistico calculates the percentage increase in your locations' views, searches, engagement, and actions. Alongside these percentages, the total figures are also presented for your convenience. By clicking on each metric box, you can view a graph that illustrates the growth trends, helping you identify peaks in the data and pinpoint when the metrics began to improve.
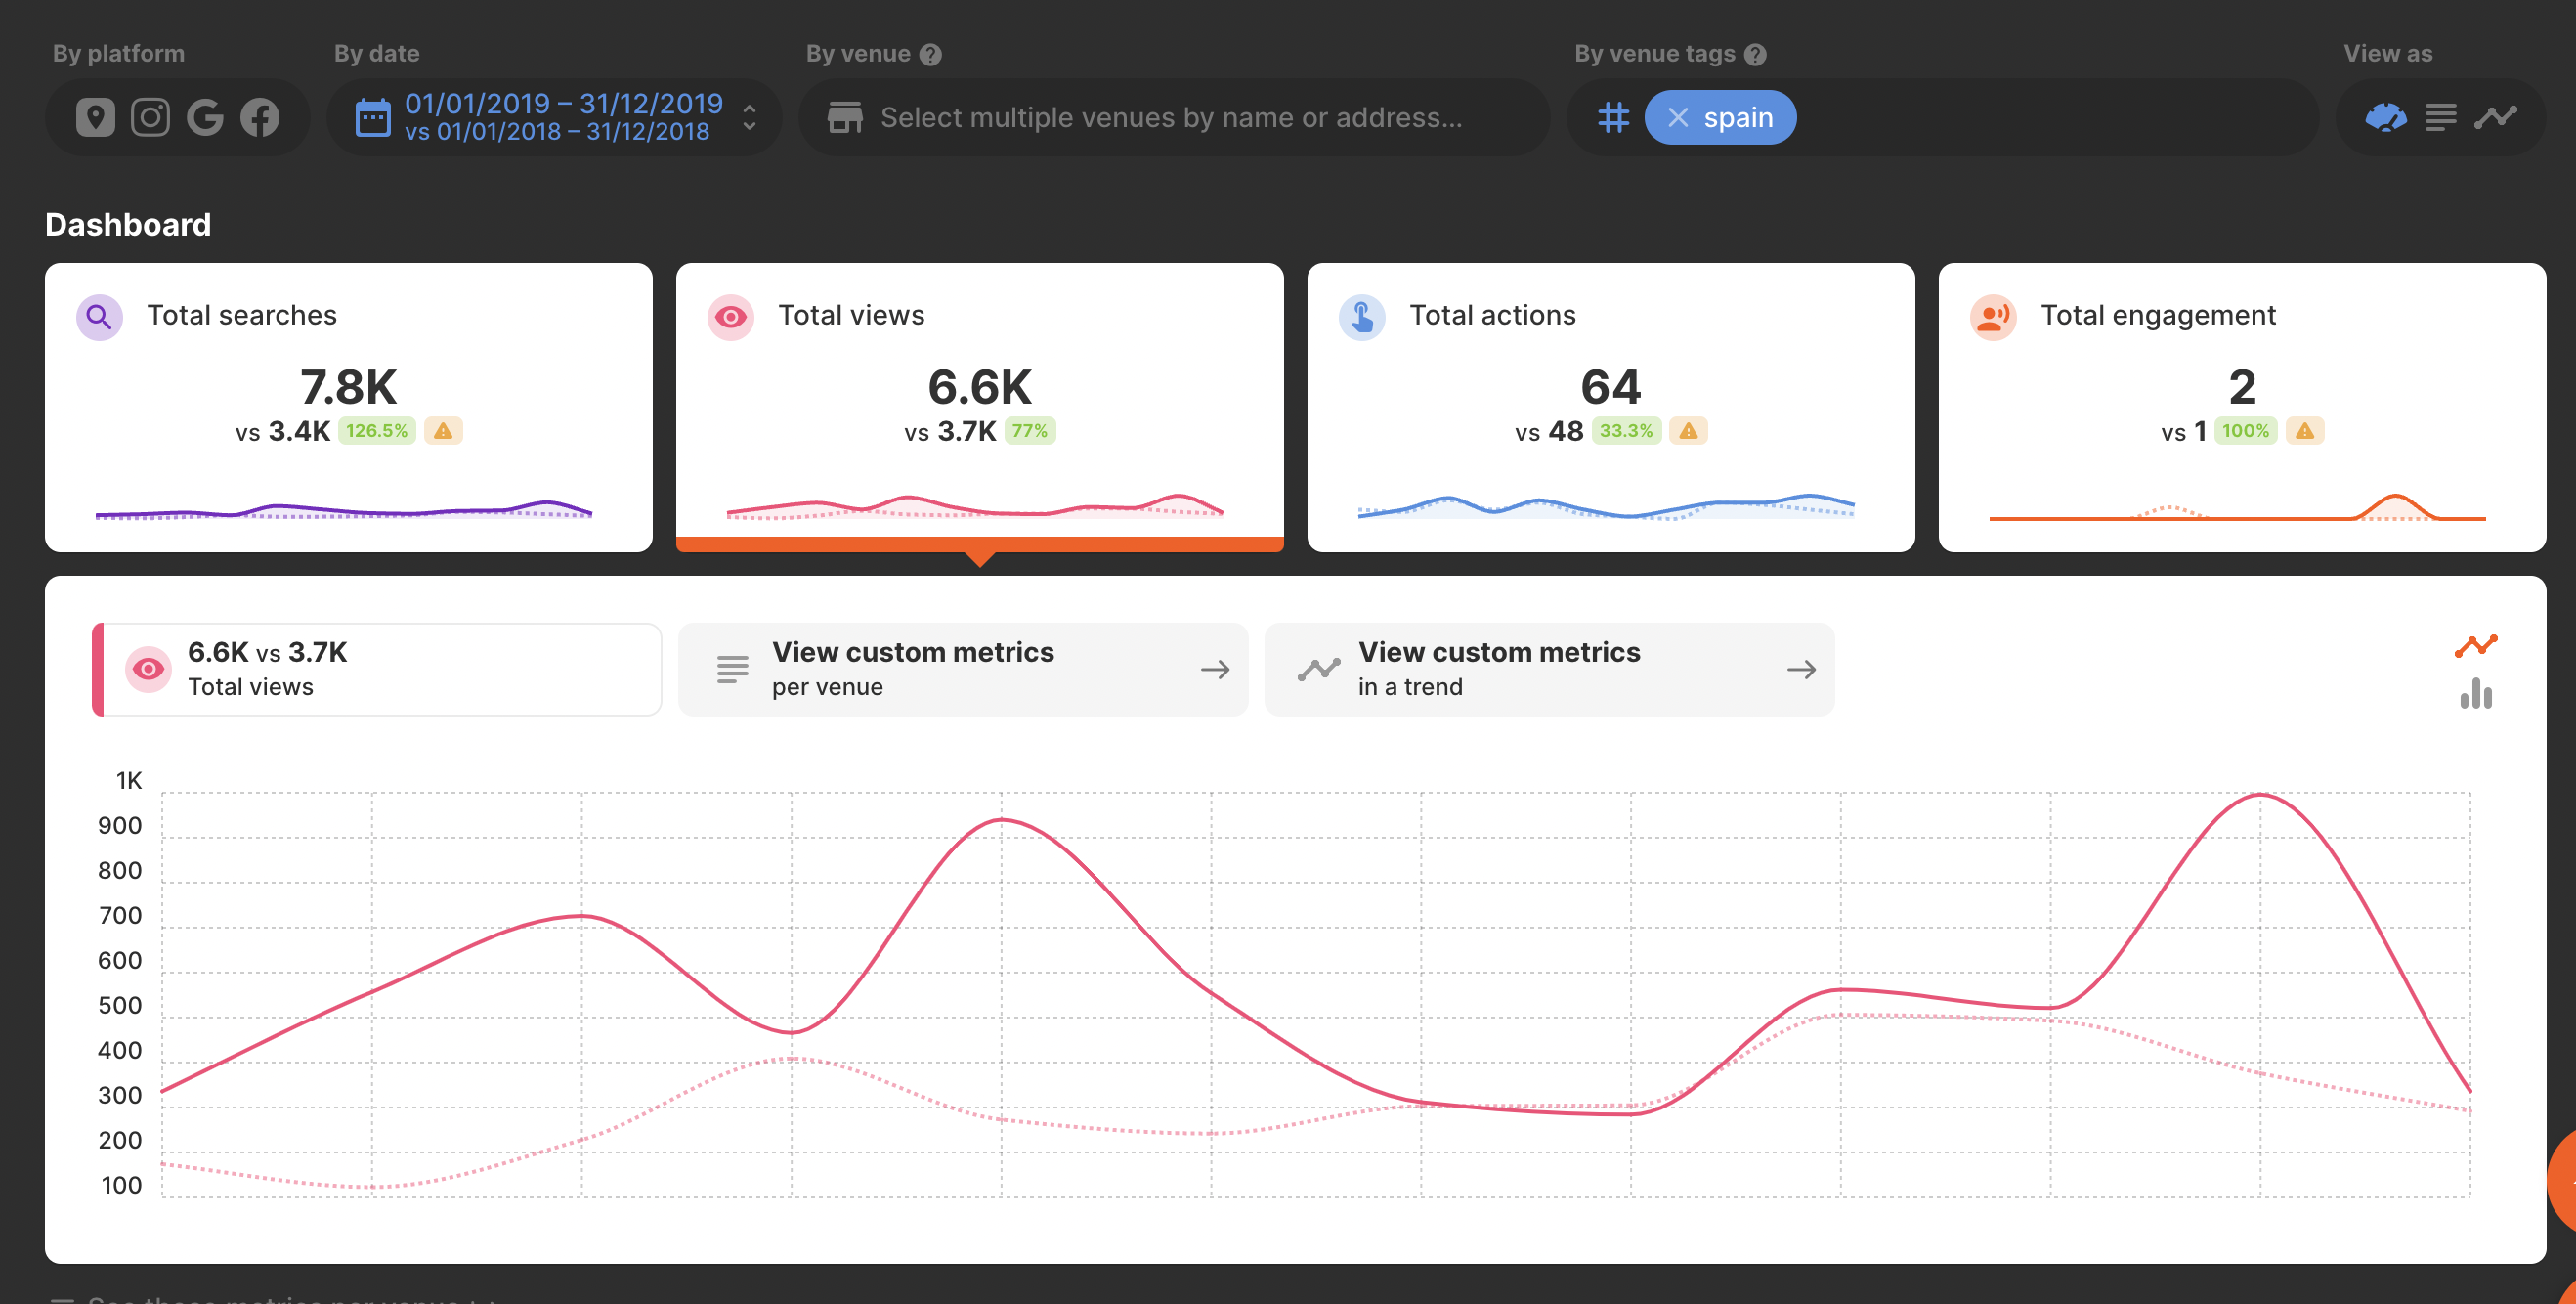
Based on these peaks and turn points, it is easy to see which actions worked and which did not and make more data-driven decisions.
You can easily export your metrics to Excel or CSV format by clicking the orange button with the arrow located in the upper right corner. Please note that the export will include all metrics in their default state, without any customizations you may have applied. This same principle applies to data feeds as well.