What is a reviews dashboard and what for it can be used?
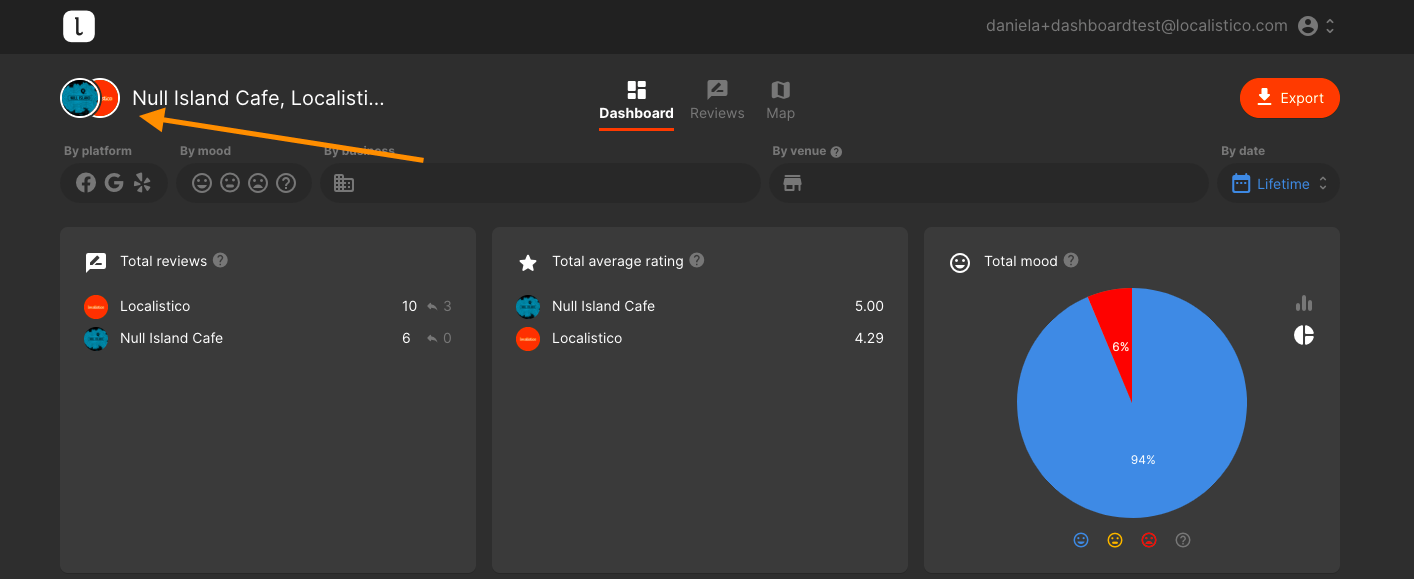
The Dashboard is a powerful reviews tool that provides comprehensive insights into the feedback your customers have shared about your business or businesses. It also enables you to respond to those reviews. You can access the Dashboard either from the main login page or by clicking on your logo in the top left-hand corner of the Localistico platform and selecting Dashboard.


In the dashboard, you have the flexibility to view data for a single business or to analyse information for all the businesses you manage simultaneously.

You can also refine your data analysis by filtering information based on platform, venue, mood, and time frame. Additionally, you have the option to export either an overview of the information or a summary of locations in Excel format, allowing you to easily access numerical data for each location. For instance, by exporting the locations summary, you can view the average rating for each store within the chosen period.

From the Reviews Dashboard, you may get the following information:
- Reviews by platform and average rating by the platform:
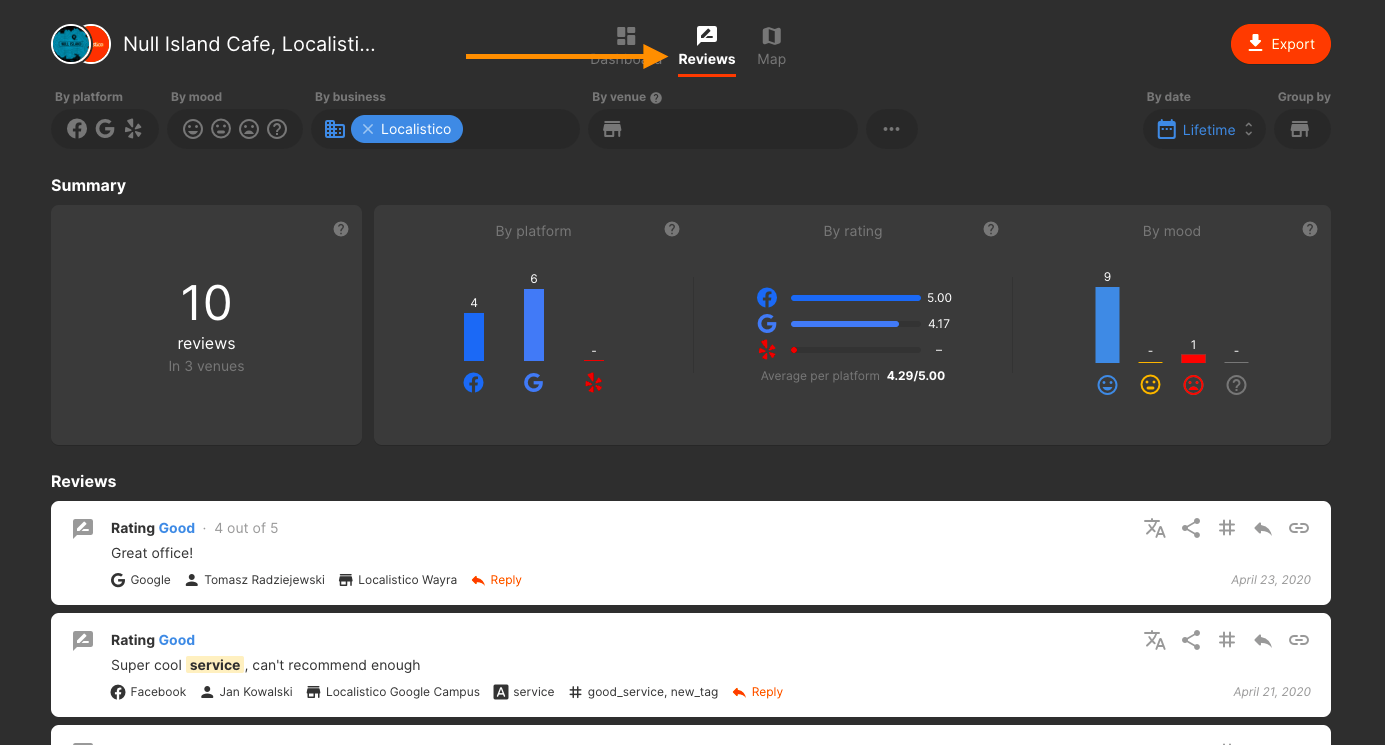
The "Reviews by platform" section displays the total number of reviews your customers submitted across each platform during the specified period. This feature enables you to easily identify which platforms generate the highest volume of reviews.
The average rating by platform indicates the average score—ranging from 1 to 5—calculated solely from the reviews submitted on a specific platform during the selected timeframe across all locations. This feature enables you to identify any platforms that may be experiencing unusually high or low ratings in comparison to your overall average.
It's common for one or two platforms to account for the majority of reviews within a particular business category.
- The trend of the reviews:
Displays the historical trend of the number of reviews over the selected period. This feature allows you to determine whether the overall volume of reviews is increasing or decreasing. You can hover over each data point for more detailed insights.
- The trend of the mood:
Displays the historical trend of reviews over the selected period, categorized as positive, neutral, or negative. This feature enables you to assess whether the overall volume of reviews is increasing or decreasing.
- The trend of the average rating:
Displays the historical progression of the average rating over the chosen time period, enabling you to identify trends in overall ratings—whether they are increasing or decreasing.
- A list of the best and worst locations by average rating during the selected period:

View and reply to reviews from the Dashboard
In the Reviews Dashboard, you can view all the reviews your customers have submitted for your business or businesses, and you have the ability to respond to them. However, the option to reply to reviews may be restricted for certain users. For more detailed guidance on how to filter reviews and respond to them, please refer to the following articles:
- Can I answer reviews directly from Localistico? How to reply to reviews?
- How to filter reviews and obtain reports?

View reviews distribution geographically:
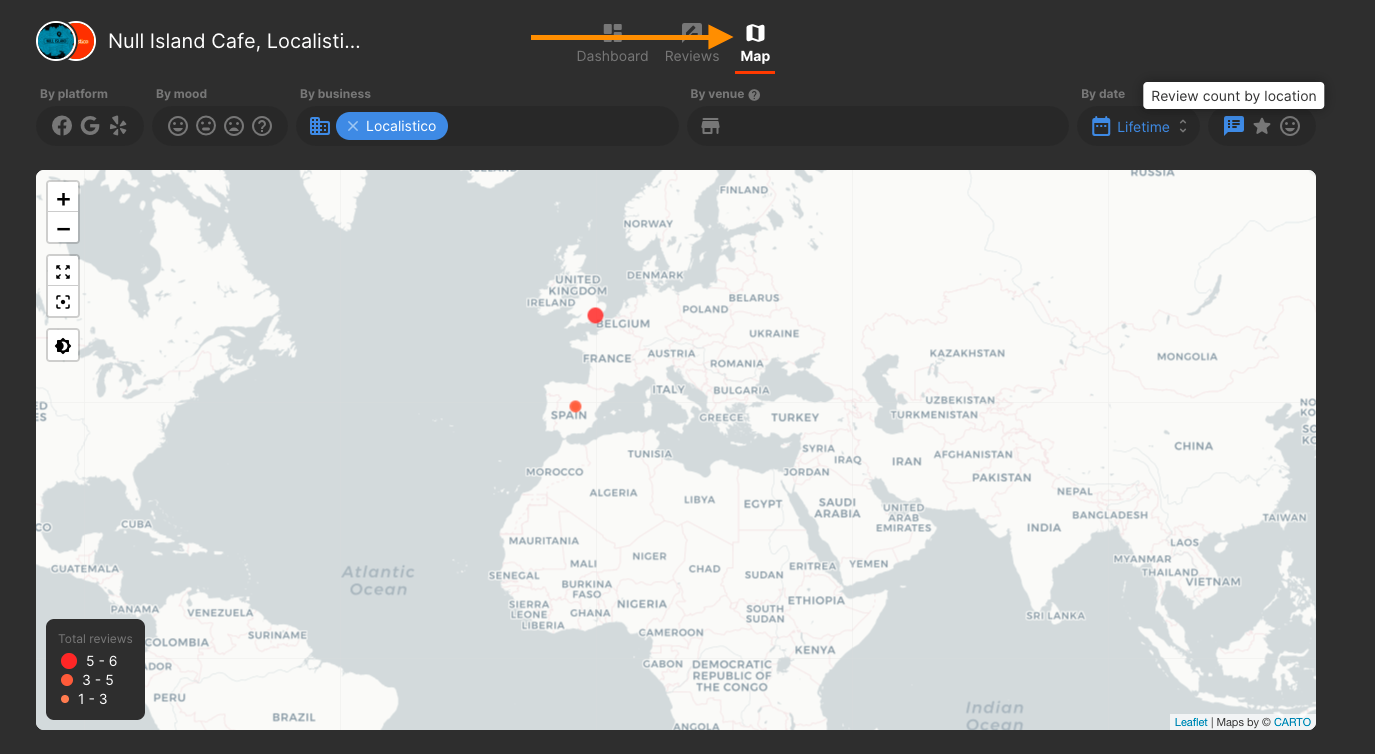
On the Map tab, you can visualize the geographical distribution of your reviews. This feature allows you to see the total number of reviews for each location, the average rating per location, and the mood associated with those reviews.

Please be aware that the Reviews Dashboard may not be part of your subscription. If you are interested in subscribing, please contact support@localistico.com.